
Page 158 - Fluid Power Engineering
P. 158
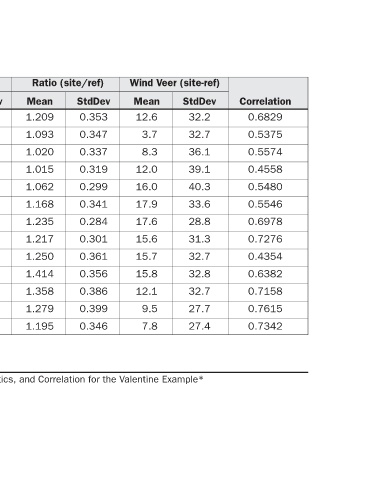
Correlation  0.6829  0.5375  0.5574  0.4558  0.5480  0.5546  0.6978  0.7276  0.4354  0.6382  0.7158  0.7615  0.7342


                (site-ref)  StdDev  32.2  32.7  36.1  39.1  40.3  33.6  28.8  31.3  32.7  32.8  32.7  27.7  27.4  Example*


                Veer

                Wind  Mean  12.6  3.7  8.3  12.0  16.0  17.9  17.6  15.6  15.7  15.8  12.1  9.5  7.8  Valentine


                (site/ref)  StdDev  0.353  0.347  0.337  0.319  0.299  0.341  0.284  0.301  0.361  0.356  0.386  0.399  0.346  the  for


                Ratio  Mean  1.209  1.093  1.020  1.015  1.062  1.168  1.235  1.217  1.250  1.414  1.358  1.279  1.195  Correlation  and


                Speed  StdDev  3.2  3.1  2.9  2.5  2.5  2.5  2.7  2.8  2.2  2.0  2.9  3.9  4.0  Statistics,


                Wind                                              Direction
                Ref  Mean  5.90  6.29  5.52  4.73  4.73  5.44  6.00  5.91  4.63  4.54  5.31  7.02  7.53
                                                                  Wind

                Speed  StdDev  3.5  3.3  3.0  2.4  2.5  2.7  3.1  3.0  2.5  2.8  3.5  4.2  4.4  Statistics,


                Wind                                              Speed

                Site  Mean  7.06  6.55  5.33  4.78  5.12  6.24  7.34  7.29  6.31  6.66  7.49  8.80  8.58  Wind


                   Count  5888  514  286  277  322  520  773  684  363  333  418  655  743  ∗ Computed in WindPRO.  of Summary


                   Sector  All  N  NNE  ENE  E  ESE  SSE  S  SSW  WSW  W  WNW  NNW  7-6  TABLE


              132