
Page 321 - Fluid Power Engineering
P. 321
Financial Modeling of W ind Projects 287
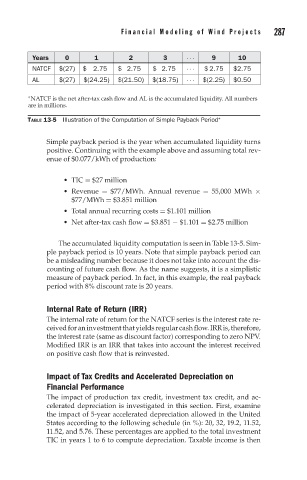
Years 0 1 2 3 ··· 9 10
NATCF $(27) $ 2.75 $ 2.75 $ 2.75 ··· $ 2.75 $2.75
AL $(27) $(24.25) $(21.50) $(18.75) ··· $(2.25) $0.50
NATCF is the net after-tax cash flow and AL is the accumulated liquidity. All numbers
∗
are in millions.
TABLE 13-5 Illustration of the Computation of Simple Payback Period ∗
Simple payback period is the year when accumulated liquidity turns
positive. Continuing with the example above and assuming total rev-
enue of $0.077/kWh of production:
TIC = $27 million
Revenue = $77/MWh. Annual revenue = 55,000 MWh ×
$77/MWh = $3.851 million
Total annual recurring costs = $1.101 million
Net after-tax cash flow = $3.851 − $1.101 = $2.75 million
The accumulated liquidity computation is seen in Table 13-5. Sim-
ple payback period is 10 years. Note that simple payback period can
be a misleading number because it does not take into account the dis-
counting of future cash flow. As the name suggests, it is a simplistic
measure of payback period. In fact, in this example, the real payback
period with 8% discount rate is 20 years.
Internal Rate of Return (IRR)
The internal rate of return for the NATCF series is the interest rate re-
ceivedforaninvestmentthatyieldsregularcashflow.IRRis,therefore,
the interest rate (same as discount factor) corresponding to zero NPV.
Modified IRR is an IRR that takes into account the interest received
on positive cash flow that is reinvested.
Impact of Tax Credits and Accelerated Depreciation on
Financial Performance
The impact of production tax credit, investment tax credit, and ac-
celerated depreciation is investigated in this section. First, examine
the impact of 5-year accelerated depreciation allowed in the United
States according to the following schedule (in %): 20, 32, 19.2, 11.52,
11.52, and 5.76. These percentages are applied to the total investment
TIC in years 1 to 6 to compute depreciation. Taxable income is then