
Page 324 - Fluid Power Engineering
P. 324
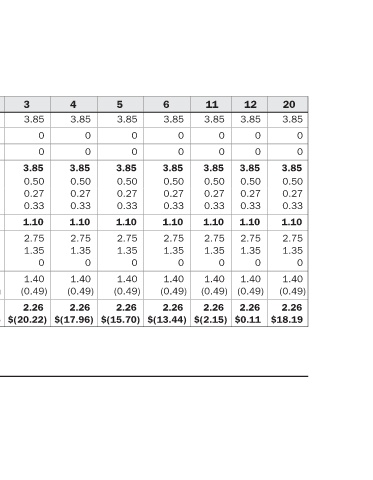
20  3.85  0  0  3.85  0.50  0.27  0.33  1.10  2.75  1.35  0  1.40  (0.49)  2.26  $18.19


                   12  3.85  0  0  3.85  0.50  0.27  0.33  1.10  2.75  1.35  0  1.40  (0.49)  2.26  $0.11


                   11  3.85  0  0  3.85  0.50  0.27  0.33  1.10  2.75  1.35  0  1.40  (0.49)  2.26  $(2.15)

                      3.85  0  0  3.85  0.50  0.27  0.33  1.10  2.75  1.35  0  1.40  (0.49)  2.26
                   6                                    $(13.44)

                      3.85  0  0  3.85  0.50  0.27  0.33  1.10  2.75  1.35  0  1.40  (0.49)  2.26
                   5                                    $(15.70)

                      3.85  0  0  3.85  0.50  0.27  0.33  1.10  2.75  1.35  0  1.40  (0.49)  2.26
                   4                                    $(17.96)

                      3.85  0  0  3.85  0.50  0.27  0.33  1.10  2.75  1.35  0  1.40  (0.49)  2.26
                   3                                    $(20.22)

                      3.85  0  0  3.85  0.50  0.27  0.33  1.10  2.75  1.35  0  1.40  (0.49)  2.26
                   2                                    $(22.48)

                      3.85  0  0  3.85  0.50  0.27  0.33  1.10  2.75  1.35  0  1.40  (0.49)  2.26
                   1                                    $(24.74)   Depreciation ∗,†

                                                      (27.00)
                   0                                    $(27.00)   Linear

                      PPA                                          with
                      per               Expenses      Flow
                      Revenue  ($/kWh)  Maintenance  Fund  Payment  Benefit/(Liability)  Cash  Liquidity  Statement


                      Sales  Rate  &  Contingency  Expense  Operating  Interest  Income  Project  ∗ Some years are skipped for brevity. † All numbers are in millions.  Income

                      Electricity  Tag  Green  Operations  Annual  Depreciation  Tax  After-Tax  Accumulated  13-6
                   Years    PTC  Revenue  O&M  Other  Total  EBITDA  Debt  Taxable  Total  Net  TABLE


                                                                    289