
Page 326 - Fluid Power Engineering
P. 326
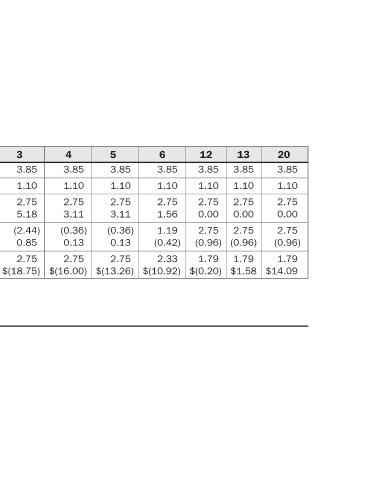
20  3.85  1.10  2.75  0.00  2.75  (0.96)  1.79  $14.09


                            13  3.85  1.10  2.75  0.00  2.75  (0.96)  1.79  $1.58


                            12  3.85  1.10  2.75  0.00  2.75  (0.96)  1.79  $(0.20)


                               3.85  1.10  2.75  1.56  1.19  (0.42)  2.33
                            6                   $(10.92)


                               3.85  1.10  2.75  3.11  (0.36)  0.13  2.75
                            5                   $(13.26)

                               3.85  1.10  2.75  3.11  (0.36)  0.13  2.75
                            4                   $(16.00)


                               3.85  1.10  2.75  5.18  (2.44)  0.85  2.75
                            3                   $(18.75)

                               3.85  1.10  2.75  8.64  (5.89)  2.06  2.75
                            2                   $(21.50)

                               3.85  1.10  2.75  5.40  0.93  2.75  Depreciation ∗,†
                            1            (2.65)  $(24.25)


                                              (27.00)      Accelerated
                            0                   $(27.00)

                                 Expenses     Flow  Cash   with Statement


                                 Operating  Benefit/(Liability)  Project  Liquidity  Income


                                 Annual  Depreciation  Income  Tax  After-Tax  Accumulated  ∗ Tax benefit is not monetized. † All numbers are in millions.  13-7
                            Years  Revenue  Total  EBITDA  Taxable  Total  Net  TABLE


              290