Page 327 - Fluid Power Engineering
P. 327

20
                            10
                            9
                            6
                            5
                            4
                            3
                              3.85  3.85  3.85  3.85  3.85  3.85  3.85  3.85  1.10  1.10  1.10  1.10  1.10  1.10  1.10  1.10  2.75  2.75  2.75  2.75  2.75  2.75  2.75  2.75  0.00  0.00  0.00  1.56  3.11  3.11  5.18  8.64  2.75  2.75  2.75  1.19  (0.36)  (0.36)  (2.44)  (5.89)  (0.96)  (0.96)  (0.96)  (0.42)  0.13  0.13  0.85
                            2                   $(18.51)   Is
                              3.85  1.10  2.75  5.40  (2.65)  0.93  3.68  Benefit
                            1                   $(23.32)   Tax
                                              (27.00)      Except
                            0                   $(27.00)   13-6

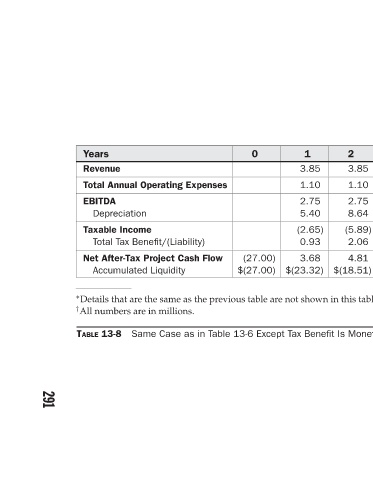
                                 Expenses     Flow  Cash ∗ Details that are the same as the previous table are not shown in this table.  Table  in  as


                                 Operating  Benefit/(Liability)  Project  Liquidity  Case  Same


                                 Annual  Depreciation  Income  Tax  After-Tax  Accumulated  † All numbers are in millions.  13-8

                            Years  Revenue  Total  EBITDA  Taxable  Total  Net  TABLE


                                                                    291
   322   323   324   325   326   327   328   329   330   331   332