Page 330 - Fluid Power Engineering
P. 330

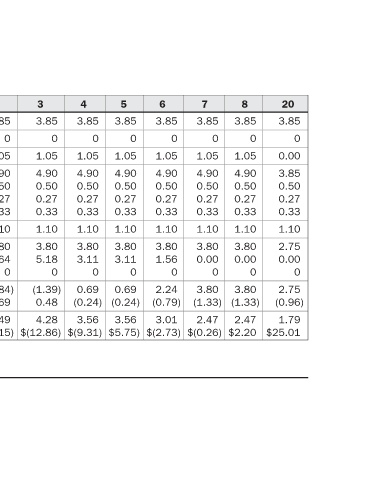
20  3.85  0  0.00  3.85  0.50  0.27  0.33  1.10  2.75  0.00  0  2.75  (0.96)  1.79  $25.01


                      3.85  1.05  4.90  0.50  0.27  0.33  1.10  3.80  0.00  3.80  2.47  $2.20
                   8     0                      0    (1.33)

                      3.85  0  1.05  4.90  0.50  0.27  0.33  1.10  3.80  0.00  0  3.80  (1.33)  2.47
                   7                                      $(0.26)

                      3.85  0  1.05  4.90  0.50  0.27  0.33  1.10  3.80  1.56  0  2.24  (0.79)  3.01
                   6                                      $(2.73)

                      3.85  0  1.05  4.90  0.50  0.27  0.33  1.10  3.80  3.11  0  0.69  (0.24)  3.56
                   5                                      $5.75)


                      3.85  0  1.05  4.90  0.50  0.27  0.33  1.10  3.80  3.11  0  0.69  (0.24)  3.56
                   4                                      $(9.31)

                      3.85  0  1.05  4.90  0.50  0.27  0.33  1.10  3.80  5.18  0  (1.39)  0.48  4.28
                   3                                      $(12.86)


                      3.85  0  1.05  4.90  0.50  0.27  0.33  1.10  3.80  8.64  0  (4.84)  1.69  5.49
                   2                                      $(17.15)


                      3.85  0  1.05  4.90  0.50  0.27  0.33  1.10  3.80  5.40  0  (1.60)  0.56  4.36
                   1                                      $(22.64)


                                                        (27.00)
                   0                                      $(27.00)  Monetized ∗


                      PPA
                      per                Expenses       Flow       Benefit
                      Revenue  ($/kWh)  Maintenance  Fund  Payment  Benefit/(Liability)  Cash  Liquidity  Tax  and


                      Sales  Rate  &  Contingency  Expense  Operating  Interest  Income  Project  ∗ All numbers are in millions.  PTC  With

                      Electricity  Tag  Green  Operations  Annual  Depreciation  Tax  After-Tax  Accumulated  13-9

                   Years    PTC  Revenue  O&M  Other  Total  EBITDA  Debt  Taxable  Total  Net  TABLE


              292
   325   326   327   328   329   330   331   332   333   334   335