
Page 336 - Fluid Power Engineering
P. 336
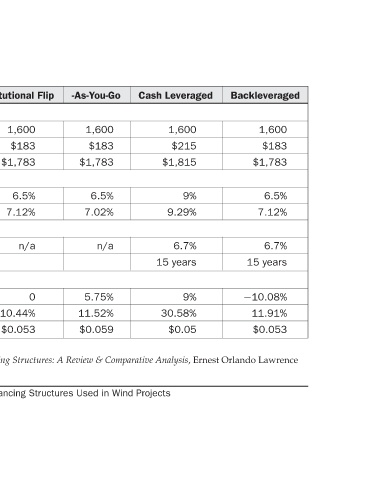
Backleveraged  1,600  $183  $1,783  6.5%  7.12%  6.7%  years  15  −10.08%  11.91%  $0.053


                  Leveraged  1,600  $215  $1,815  9%  9.29%  6.7%  years  9%  30.58%  $0.05


                  Cash                        15                     Projects

                                                                     Wind
                  -As-You-Go  1,600  $183  $1,783  6.5%  7.02%  n/a  5.75%  11.52%  $0.059  in  Used


                  Flip                      n/a     0                Structures
                  Institutional  1,600  $183  $1,783  6.5%  7.12%  10.44%  $0.053 Source: LBL. Harper, J. P. Karcher, M. D., Bolinger, M. Wind Project Financing Structures: A Review & Comparative Analysis, Ernest Orlando Lawrence  Financing


                                                                     Various
                  Flip                      n/a                      of
                  Strategic  1,600  $183  $1,783  6.5%  7.02%  6.5%  37.44%  $0.061  Performance


                  Corporate  $1,600  $125  $1,725  n/a  n/a  n/a  6.64%  10%  $0.063  Financial


                                return           return          Berkeley National Laboratory, Berkeley, CA, 2007. LBNL-63434.  and

                                tax  IRR  Computed  tax   kWh        Assumptions
                             cost
                     assumptions  cost  installed  after  investor  Target  IRR,  assumptions  rate  after  IRR  IRR  per  LCOE


                     Cost  Hard  cost  Soft  Total  Tax  10-year  20-year  Debt  Interest  Maturity  Developer  10-year  20-year  20-year  13-12  TABLE


              296