
Page 337 - Fluid Power Engineering
P. 337
Financial Modeling of W ind Projects 297
Lender
Int+Princ
Wind
Developer Tax Investor
Wind
Project
Energy Output, X 1 %
kWh
kWh*(PPA+REC) kWh*PTC
100-X 1 %
Revenue, PTC
Rev
Rev-OE-Int-Dep
Rev-OE X 2 %
Taxable
Income, TI
EBITDA
TI*TR
EBITDA-Int-Princ-Tax
Tax Gain/
100-X 2 % X 3 %
Loss
100-X 3 %
After-tax
Cash Flow
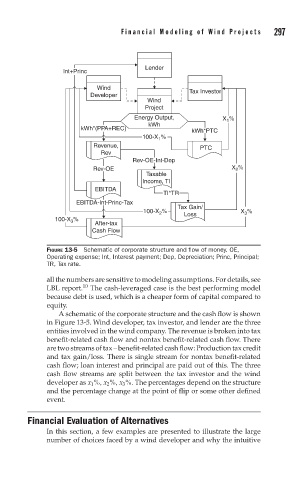
FIGURE 13-5 Schematic of corporate structure and flow of money. OE,
Operating expense; Int, Interest payment; Dep, Depreciation; Princ, Principal;
TR, Tax rate.
all the numbers are sensitive to modeling assumptions. For details, see
LBL report. 10 The cash-leveraged case is the best performing model
because debt is used, which is a cheaper form of capital compared to
equity.
A schematic of the corporate structure and the cash flow is shown
in Figure 13-5. Wind developer, tax investor, and lender are the three
entities involved in the wind company. The revenue is broken into tax
benefit-related cash flow and nontax benefit-related cash flow. There
are two streams of tax – benefit-related cash flow: Production tax credit
and tax gain/loss. There is single stream for nontax benefit-related
cash flow; loan interest and principal are paid out of this. The three
cash flow streams are split between the tax investor and the wind
developer as x 1 %, x 2 %, x 3 %. The percentages depend on the structure
and the percentage change at the point of flip or some other defined
event.
Financial Evaluation of Alternatives
In this section, a few examples are presented to illustrate the large
number of choices faced by a wind developer and why the intuitive