
Page 48 - Fluid Power Engineering
P. 48
26 Chapter Three
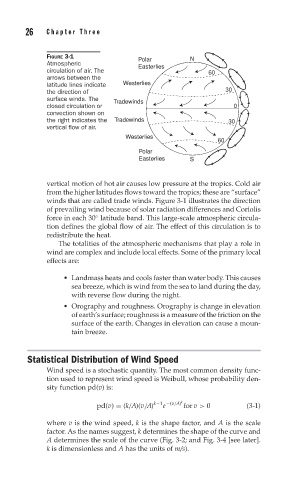
FIGURE 3-1 Polar N
Atmospheric Easterlies
circulation of air. The 60
arrows between the
latitude lines indicate Westerlies
30
the direction of
surface winds. The Tradewinds
closed circulation or 0
convection shown on
the right indicates the Tradewinds 30
vertical flow of air.
Westerlies
60
Polar
Easterlies S
vertical motion of hot air causes low pressure at the tropics. Cold air
from the higher latitudes flows toward the tropics; these are “surface”
winds that are called trade winds. Figure 3-1 illustrates the direction
of prevailing wind because of solar radiation differences and Coriolis
◦
force in each 30 latitude band. This large-scale atmospheric circula-
tion defines the global flow of air. The effect of this circulation is to
redistribute the heat.
The totalities of the atmospheric mechanisms that play a role in
wind are complex and include local effects. Some of the primary local
effects are:
Landmass heats and cools faster than water body. This causes
sea breeze, which is wind from the sea to land during the day,
with reverse flow during the night.
Orography and roughness. Orography is change in elevation
of earth’s surface; roughness is a measure of the friction on the
surface of the earth. Changes in elevation can cause a moun-
tain breeze.
Statistical Distribution of Wind Speed
Wind speed is a stochastic quantity. The most common density func-
tion used to represent wind speed is Weibull, whose probability den-
sity function pd(v) is:
e
pd(v) = (k/A)(v/A) k−1 −(v/A) k for v > 0 (3-1)
where v is the wind speed, k is the shape factor, and A is the scale
factor. As the names suggest, k determines the shape of the curve and
A determines the scale of the curve (Fig. 3-2; and Fig. 3-4 [see later].
k is dimensionless and A has the units of m/s).