
Page 53 - Fluid Power Engineering
P. 53
Properties of W ind 31
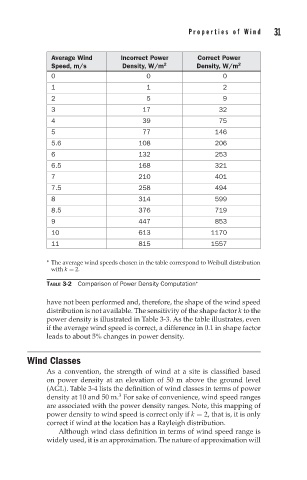
Average Wind Incorrect Power Correct Power
Speed, m/s Density, W/m 2 Density, W/m 2
0 0 0
1 1 2
2 5 9
3 17 32
4 39 75
5 77 146
5.6 108 206
6 132 253
6.5 168 321
7 210 401
7.5 258 494
8 314 599
8.5 376 719
9 447 853
10 613 1170
11 815 1557
∗ The average wind speeds chosen in the table correspond to Weibull distribution
with k = 2.
TABLE 3-2 Comparison of Power Density Computation ∗
have not been performed and, therefore, the shape of the wind speed
distribution is not available. The sensitivity of the shape factor k to the
power density is illustrated in Table 3-3. As the table illustrates, even
if the average wind speed is correct, a difference in 0.1 in shape factor
leads to about 5% changes in power density.
Wind Classes
As a convention, the strength of wind at a site is classified based
on power density at an elevation of 50 m above the ground level
(AGL). Table 3-4 lists the definition of wind classes in terms of power
3
density at 10 and 50 m. For sake of convenience, wind speed ranges
are associated with the power density ranges. Note, this mapping of
power density to wind speed is correct only if k = 2, that is, it is only
correct if wind at the location has a Rayleigh distribution.
Although wind class definition in terms of wind speed range is
widely used, it is an approximation. The nature of approximation will