
Page 54 - Fluid Power Engineering
P. 54
32 Chapter Three
0.12 45
40
0.1
35
Probability 0.06 25 Power Density, W/m2
30
0.08
20
15
0.04
10
0.02
5
0 0
0 5 10 15 20 25
Wind Speed, m/s
Probability Power density
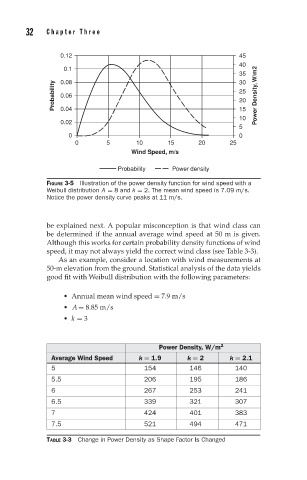
FIGURE 3-5 Illustration of the power density function for wind speed with a
Weibull distribution A = 8 and k = 2. The mean wind speed is 7.09 m/s.
Notice the power density curve peaks at 11 m/s.
be explained next. A popular misconception is that wind class can
be determined if the annual average wind speed at 50 m is given.
Although this works for certain probability density functions of wind
speed, it may not always yield the correct wind class (see Table 3-3).
As an example, consider a location with wind measurements at
50-m elevation from the ground. Statistical analysis of the data yields
good fit with Weibull distribution with the following parameters:
Annual mean wind speed = 7.9 m/s
A = 8.85 m/s
k = 3
Power Density, W/m 2
Average Wind Speed k = 1.9 k = 2 k = 2.1
5 154 146 140
5.5 206 195 186
6 267 253 241
6.5 339 321 307
7 424 401 383
7.5 521 494 471
TABLE 3-3 Change in Power Density as Shape Factor Is Changed