
Page 55 - Fluid Power Engineering
P. 55
Properties of W ind 33
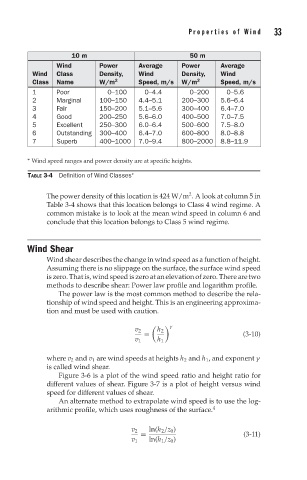
10 m 50 m
Wind Power Average Power Average
Wind Class Density, Wind Density, Wind
Class Name W/m 2 Speed, m/s W/m 2 Speed, m/s
1 Poor 0–100 0–4.4 0–200 0–5.6
2 Marginal 100–150 4.4–5.1 200–300 5.6–6.4
3 Fair 150–200 5.1–5.6 300–400 6.4–7.0
4 Good 200–250 5.6–6.0 400–500 7.0–7.5
5 Excellent 250–300 6.0–6.4 500–600 7.5–8.0
6 Outstanding 300–400 6.4–7.0 600–800 8.0–8.8
7 Superb 400–1000 7.0–9.4 800–2000 8.8–11.9
∗ Wind speed ranges and power density are at specific heights.
TABLE 3-4 Definition of Wind Classes ∗
2
The power density of this location is 424 W/m . A look at column 5 in
Table 3-4 shows that this location belongs to Class 4 wind regime. A
common mistake is to look at the mean wind speed in column 6 and
conclude that this location belongs to Class 5 wind regime.
Wind Shear
Wind shear describes the change in wind speed as a function of height.
Assuming there is no slippage on the surface, the surface wind speed
is zero. That is, wind speed is zero at an elevation of zero. There are two
methods to describe shear: Power law profile and logarithm profile.
The power law is the most common method to describe the rela-
tionship of wind speed and height. This is an engineering approxima-
tion and must be used with caution.
γ
v 2 h 2
= (3-10)
v 1 h 1
where v 2 and v 1 are wind speeds at heights h 2 and h 1 , and exponent γ
is called wind shear.
Figure 3-6 is a plot of the wind speed ratio and height ratio for
different values of shear. Figure 3-7 is a plot of height versus wind
speed for different values of shear.
An alternate method to extrapolate wind speed is to use the log-
arithmic profile, which uses roughness of the surface. 4
v 2 ln(h 2 /z 0 )
= (3-11)
v 1 ln(h 1 /z 0 )