Page 51 - Fluid Power Engineering
P. 51

Properties of W ind   29


              Empirically, it has been observed that wind speed in most locations is
              a Weibull distribution. Furthermore, the value of k is approximately
              2 for most wind profiles.
                 A few observations are in order for Weibull as a distribution for
              windspeed.Ask increases,theheightofthecurveincreases,whichim-
              plies that the curve becomes narrower with a smaller tail—probability
              drops quickly at higher wind speeds. This can lead to lower energy
              at higher values of k. That is, if two wind speed distributions have
              the same average wind speed, but different value of k, say, k = 2 and
              k= 3, the latter case will yield lower energy.

              Mean and Mode of Weibull Distribution for Wind Speed
              The mode of a Weibull distribution is:

                                1
                           k − 1
                                 / K
                Mode = A                                           (3-2)
                            k
                                   1

                Mean = ¯v = A  1 +                                 (3-3)
                                   k


                                                                2
                                     2     2     1      2    1 +  k
                         2
                             2
              Variance = σ = c    1 +   −    1 +     = ¯v          − 1
                                     k           k          2  1 +  1
                                                                 k
                                                                   (3-4)
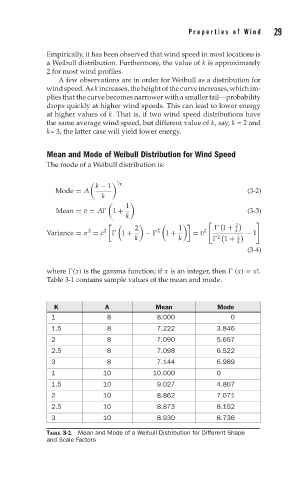
              where  (x) is the gamma function; if x is an integer, then   (x) = x!.
              Table 3-1 contains sample values of the mean and mode.
                K            A             Mean            Mode
               1              8            8.000               0
               1.5            8            7.222           3.846
               2              8            7.090           5.657
               2.5            8            7.098           6.522
               3              8            7.144           6.989
               1             10           10.000           0
               1.5           10            9.027           4.807
               2             10            8.862           7.071
               2.5           10            8.873           8.152
               3             10            8.930           8.736

              TABLE 3-1  Mean and Mode of a Weibull Distribution for Different Shape
              and Scale Factors
   46   47   48   49   50   51   52   53   54   55   56