
Page 92 - Fluid Power Engineering
P. 92
70 Chapter Five
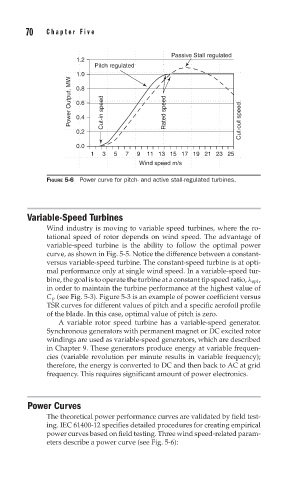
Passive Stall regulated
1.2
Pitch regulated
1.0
Power Output, MW 0.8 Cut-in speed Rated speed
0.6
0.4
0.2 Cut-out speed
0.0
1 3 5 7 9 11 13 15 17 19 21 23 25
Wind speed m/s
FIGURE 5-6 Power curve for pitch- and active stall-regulated turbines.
Variable-Speed Turbines
Wind industry is moving to variable speed turbines, where the ro-
tational speed of rotor depends on wind speed. The advantage of
variable-speed turbine is the ability to follow the optimal power
curve, as shown in Fig. 5-5. Notice the difference between a constant-
versus variable-speed turbine. The constant-speed turbine is at opti-
mal performance only at single wind speed. In a variable-speed tur-
bine, the goal is to operate the turbine at a constant tip speed ratio, λ opt ,
in order to maintain the turbine performance at the highest value of
C p (see Fig. 5-3). Figure 5-3 is an example of power coefficient versus
TSR curves for different values of pitch and a specific aerofoil profile
of the blade. In this case, optimal value of pitch is zero.
A variable rotor speed turbine has a variable-speed generator.
Synchronous generators with permanent magnet or DC excited rotor
windings are used as variable-speed generators, which are described
in Chapter 9. These generators produce energy at variable frequen-
cies (variable revolution per minute results in variable frequency);
therefore, the energy is converted to DC and then back to AC at grid
frequency. This requires significant amount of power electronics.
Power Curves
The theoretical power performance curves are validated by field test-
ing. IEC 61400-12 specifies detailed procedures for creating empirical
power curves based on field testing. Three wind speed-related param-
eters describe a power curve (see Fig. 5-6):