
Page 85 - Wire Bonding in Microelectronics
P. 85
64 Cha pte r T h ree
When a metal (wire) is subjected to a repetitive stress, such as
bending back and forth, it may eventually fail even though that stress
is much lower than is required to fracture it in one single bend or pull.
This is called fatigue. Data on material fatigue are usually given as
stress versus the number of cycles (S-N) required to cause failure.
Most wire (bond) fatigue data have been obtained in an accelerated
manner by mechanically flexing short lengths of wire at some con-
stant operating temperature (usually room temperature). However,
field failure conditions are seldom so simple. Power (on/off) and other
temperature cycling involves various periods of heating, holding at
temperature for various times, and cooling at various rates. In real
devices, this thermal cycling flexes the wire, which introduces work
damage. But, it may also partially anneal that damage during periods
of continuous high-temperature operation.
There has been relatively little actual fatigue data published for
bonding wires, and much of the data are calculated from other data
or presented in different forms [3-16, 3-17]. Some use deflection,
longitudinal strain, stress, etc., without enough information given
to convert units and directly compare data. That which is available
can only be assumed accurate for the specific (often unstated, and
usually proprietary) wire metallurgy that was used in the study,
typically comparing wire A, B, C. Often the manufacturing process
(including dopant and annealing) may have changed since the data
were published. Nevertheless, (very) approximate estimations of
wire bond life due to fatigue can be made from such generic data.
The following three S-N curves, Figs. 3-7 to 3-9, are thought to be
Thermal cycle test
20
Electromechanical
cycle test
Equivalent strain (%) 5
10
2
1
10 20 50 100 200 500
Cycles to failure (cycles)
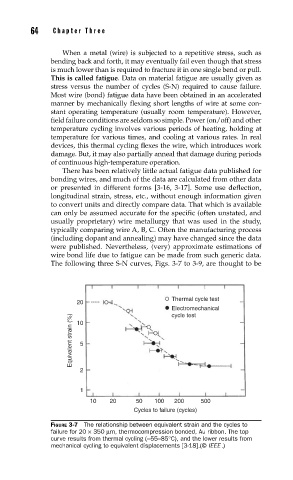
FIGURE 3-7 The relationship between equivalent strain and the cycles to
failure for 20 × 350 µm, thermocompression bonded, Au ribbon. The top
curve results from thermal cycling (−55–85°C), and the lower results from
mechanical cycling to equivalent displacements [3-18].(© IEEE .)