
Page 212 - Characterization and Properties of Petroleum Fractions - M.R. Riazi
P. 212
T1: IML
P2: KVU/KXT
QC: —/—
P1: KVU/KXT
AT029-Manual-v7.cls
8:7
AT029-04
AT029-Manual
June 23, 2007
192 CHARACTERIZATION AND PROPERTIES OF PETROLEUM FRACTIONS
and 2.2. For each physical property an appropriate mixing
rule should be applied. For example, SG of the mixture should 6 Experimental
be calculated from Eq. (3.44) as was shown in Example 4.16. 5 Predicted
For the sulfur content of a crude oil the appropriate mixing
rule is [45]: 4
(4.126) sulfur wt% of crude = x wi (sulfur wt%) i
i 3
in which x wi is the weight fraction of pseudocomponent i in Sulfur Content, wt%
the crude. The method is well demonstrated in the following 2
examples for calculation of sulfur content of crude oils. 1
Example 4.17—For the crude oil of Example 4.16 estimate
the total sulfur content in wt%. The whole crude has API grav- 0
ity of 31 and sulfur content of 2.4 wt% [45]. 0 200 400 600 800
Boiling Point, ° C
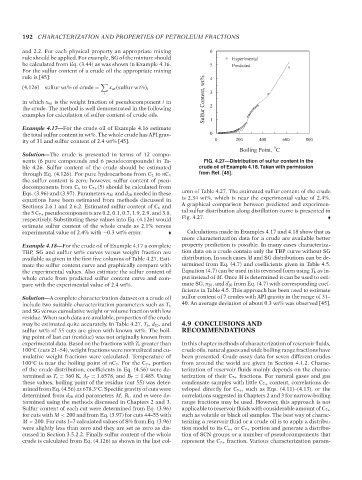
Solution—The crude is presented in terms of 12 compo-
nents (6 pure compounds and 6 pseudocompounds) in Ta- FIG. 4.27—Distribution of sulfur content in the
ble 4.26. Sulfur content of the crude should be estimated crude oil of Example 4.18. Taken with permission
from Ref. [45].
through Eq. (4.126). For pure hydrocarbons from C 2 to nC 5
the sulfur content is zero; however, sulfur content of pseu-
docomponents from C 6 to C 7+ (5) should be calculated from
Eqs. (3.96) and (3.97). Parameters n 20 and d 20 needed in these umn of Table 4.27. The estimated sulfur content of the crude
equations have been estimated from methods discussed in is 2.34 wt%, which is near the experimental value of 2.4%.
Sections 2.6.1 and 2.6.2. Estimated sulfur content of C 6 and A graphical comparison between predicted and experimen-
the5C 7+ pseudocomponents are 0.2, 0.1, 0.7, 1.9, 2.9, and 3.8, tal sulfur distribution along distillation curve is presented in
respectively. Substituting these values into Eq. (4.126) would Fig. 4.27.
estimate sulfur content of the whole crude as 2.1% versus
experimental value of 2.4% with −0.3 wt% error. Calculations made in Examples 4.17 and 4.18 show that as
more characterization data for a crude are available better
Example 4.18—For the crude oil of Example 4.17 a complete property prediction is possible. In many cases characteriza-
TBP, SG and sulfur wt% curves versus weight fraction are tion data on a crude contain only the TBP curve without SG
available as given in the first five columns of Table 4.27. Esti- distribution. In such cases M and SG distributions can be de-
mate the sulfur content curve and graphically compare with termined from Eq. (4.7) and coefficients given in Table 4.5.
the experimental values. Also estimate the sulfur content of Equation (4.7) can be used in its reversed form using T b as in-
whole crude from predicted sulfur content curve and com- put instead of M. Once M is determined it can be used to esti-
pare with the experimental value of 2.4 wt%. mate SG, n 20 , and d 20 from Eq. (4.7) with corresponding coef-
ficients in Table 4.5. This approach has been used to estimate
Solution—A complete characterization dataset on a crude oil sulfur content of 7 crudes with API gravity in the range of 31–
40. An average deviation of about 0.3 wt% was observed [45].
include two suitable characterization parameters such as T b
and SG versus cumulative weight or volume fraction with low
residue. When such data are available, properties of the crude
may be estimated quite accurately. In Table 4.27, T b , d 20 , and 4.9 CONCLUSIONS AND
sulfur wt% of 55 cuts are given with known wt%. The boil- RECOMMENDATIONS
ing point of last cut (residue) was not originally known from
experimental data. Based on the fractions with T b greater than In this chapter methods of characterization of reservoir fluids,
100 C (cuts 21–54), weight fractions were normalized and cu- crude oils, natural gases and wide boiling range fractions have
◦
mulative weight fractions were calculated. Temperature of been presented. Crude assay data for seven different crudes
100 C is near the boiling point of nC 7 . For the C 7+ portion from around the world are given in Section 4.1.2. Charac-
◦
of the crude distribution, coefficients in Eq. (4.56) were de- terization of reservoir fluids mainly depends on the charac-
termined as T o = 360 K, A T = 1.6578, and B T = 1.485. Using terization of their C 7+ fractions. For natural gases and gas
these values, boiling point of the residue (cut 55) was deter- condensate samples with little C 7+ content, correlations de-
mined from Eq. (4.56) as 678.3 C. Specific gravity of cuts were veloped directly for C 7+ , such as Eqs. (4.11)–(4.13), or the
◦
determined from d 20 and parameters M, R i , and m were de- correlations suggested in Chapters 2 and 3 for narrow-boiling
termined using the methods discussed in Chapters 2 and 3. range fractions may be used. However, this approach is not
Sulfur content of each cut were determined from Eq. (3.96) applicable to reservoir fluids with considerable amount of C 7+
for cuts with M < 200 and from Eq. (3.97) for cuts 44–55 with such as volatile or black oil samples. The best way of charac-
M > 200. For cuts 1–7 calculated values of S% from Eq. (3.96) terizing a reservoir fluid or a crude oil is to apply a distribu-
were slightly less than zero and they are set as zero as dis- tion model to its C 6+ or C 7+ portion and generate a distribu-
cussed in Section 3.5.2.2. Finally sulfur content of the whole tion of SCN groups or a number of pseudocomponents that
crude is calculated from Eq. (4.126) as shown in the last col- represent the C 7+ fraction. Various characterization param-
--`,```,`,``````,`,````,```,,-`-`,,`,,`,`,,`---
Copyright ASTM International
Provided by IHS Markit under license with ASTM Licensee=International Dealers Demo/2222333001, User=Anggiansah, Erick
No reproduction or networking permitted without license from IHS Not for Resale, 08/26/2021 21:56:35 MDT