
Page 33 - Characterization and Properties of Petroleum Fractions - M.R. Riazi
P. 33
T1: IML
P2: IML/FFX
QC: IML/FFX
P1: IML/FFX
AT029-01
AT029-Manual-v7.cls
June 22, 2007
14:26
AT029-Manual
petroleum fractions [25, 46, 47]. Estimation of other basic pa-
rameters introduced in Section 1.2, such as asphaltenes and 1. INTRODUCTION 13
sulfur contents, CH, flash and pour points, aniline point, re-
fractive index and density at SC, pseudocrtitical properties,
and acentric factor, are also considered as parts of charac-
terization of petroleum fractions [24, 28, 29, 51–53]. Some of
these properties such as the critical constants and acentric
factor are not even known for some heavy pure hydrocarbons
and should be estimated from available properties. Therefore
characterization methods also apply to pure hydrocarbons
[33]. Through characterization, one can estimate the basic
parameters needed for the estimation of various physical and
thermodynamic properties as well as to determine the com-
position and quality of petroleum fractions from available
properties easily measurable in a laboratory.
For crude oils and reservoir fluids, the basic laboratory
data are usually presented in the form of the composition
of hydrocarbons up to hexanes and the heptane-plus frac-
tion (C 7+ ), with its molecular weight and specific gravity
as shown in Table 1.2. In some cases laboratory data on a
reservoir fluid is presented in terms of the composition of
single carbon numbers or simulated distillation data where
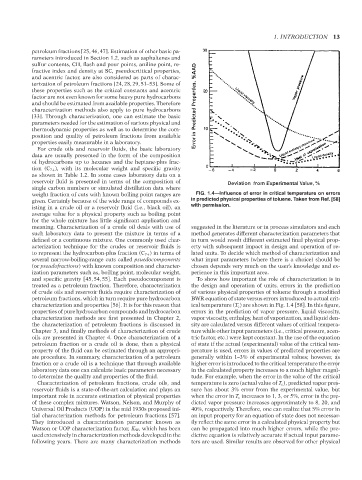
weight fraction of cuts with known boiling point ranges are FIG. 1.4—Influence of error in critical temperature on errors
given. Certainly because of the wide range of compounds ex- in predicted physical properties of toluene. Taken from Ref. [58]
isting in a crude oil or a reservoir fluid (i.e., black oil), an with permission.
average value for a physical property such as boiling point
for the whole mixture has little significant application and
meaning. Characterization of a crude oil deals with use of suggested in the literature or in process simulators and each
such laboratory data to present the mixture in terms of a method generates different characterization parameters that
defined or a continuous mixture. One commonly used char- in turn would result different estimated final physical prop-
acterization technique for the crudes or reservoir fluids is erty with subsequent impact in design and operation of re-
to represent the hydrocarbon-plus fraction (C 7+ ) in terms of lated units. To decide which method of characterization and
several narrow-boiling-range cuts called psuedocomponents what input parameters (where there is a choice) should be
(or pseudofractions) with known composition and character- chosen depends very much on the user’s knowledge and ex-
ization parameters such as, boiling point, molecular weight, perience in this important area.
and specific gravity [45, 54, 55]. Each pseudocomponent is To show how important the role of characterization is in
treated as a petroleum fraction. Therefore, characterization the design and operation of units, errors in the prediction
of crude oils and reservoir fluids require characterization of of various physical properties of toluene through a modified
petroleum fractions, which in turn require pure hydrocarbon BWR equation of state versus errors introduced to actual crit-
characterization and properties [56]. It is for this reason that ical temperature (T c ) are shown in Fig. 1.4 [58]. In this figure,
properties of pure hydrocarbon compounds and hydrocarbon errors in the prediction of vapor pressure, liquid viscosity,
characterization methods are first presented in Chapter 2, vapor viscosity, enthalpy, heat of vaporization, and liquid den-
the characterization of petroleum fractions is discussed in sity are calculated versus different values of critical tempera-
Chapter 3, and finally methods of characterization of crude ture while other input parameters (i.e., critical pressure, acen-
oils are presented in Chapter 4. Once characterization of a tric factor, etc.) were kept constant. In the use of the equation
petroleum fraction or a crude oil is done, then a physical of state if the actual (experimental) value of the critical tem-
property of the fluid can be estimated through an appropri- perature is used, errors in values of predicted properties are
--`,```,`,``````,`,````,```,,-`-`,,`,,`,`,,`---
ate procedure. In summary, characterization of a petroleum generally within 1–3% of experimental values; however, as
fraction or a crude oil is a technique that through available higher error is introduced to the critical temperature the error
laboratory data one can calculate basic parameters necessary in the calculated property increases to a much higher magni-
to determine the quality and properties of the fluid. tude. For example, when the error in the value of the critical
Characterization of petroleum fractions, crude oils, and temperature is zero (actual value of T c ), predicted vapor pres-
reservoir fluids is a state-of-the-art calculation and plays an sure has about 3% error from the experimental value, but
important role in accurate estimation of physical properties when the error in T c increases to 1, 3, or 5%, error in the pre-
of these complex mixtures. Watson, Nelson, and Murphy of dicted vapor pressure increases approximately to 8, 20, and
Universal Oil Products (UOP) in the mid 1930s proposed ini- 40%, respectively. Therefore, one can realize that 5% error in
tial characterization methods for petroleum fractions [57]. an input property for an equation of state does not necessar-
They introduced a characterization parameter known as ily reflect the same error in a calculated physical property but
Watson or UOP characterization factor, K W , which has been can be propagated into much higher errors, while the pre-
used extensively in characterization methods developed in the dictive equation is relatively accurate if actual input parame-
following years. There are many characterization methods ters are used. Similar results are observed for other physical
Copyright ASTM International
Provided by IHS Markit under license with ASTM Licensee=International Dealers Demo/2222333001, User=Anggiansah, Erick
No reproduction or networking permitted without license from IHS Not for Resale, 08/26/2021 21:56:35 MDT