
Page 131 - Characterization and Properties of Petroleum Fractions - M.R. Riazi
P. 131
QC: IML/FFX
T1: IML
P2: IML/FFX
P1: IML/FFX
June 22, 2007
AT029-03
14:23
AT029-Manual-v7.cls
AT029-Manual
3. CHARACTERIZATION OF PETROLEUM FRACTIONS 111
For each case give parameters T ◦ , A, and B in Eq. (3.35) as
accurate than values obtained in Case C. However, for this last
well as value of RS and AAD based on all data points and and 70% points are used and the predicted values are more
based on data used for the regression. Also calculate VABP case the highest error for the IBP is obtained because the first
from Eq. (3.37) and compare with actual VABP calculated data point used to obtain the constants is at 30%, which is far
from Eq. (3.6). from 0% point. Summary of results for predicted distillation
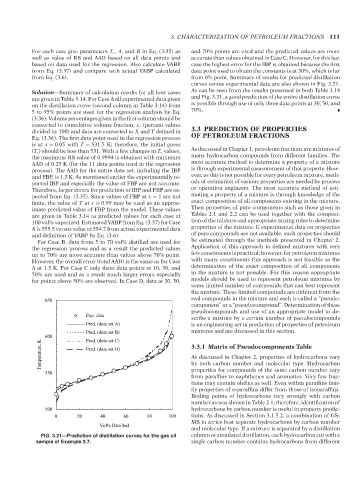
curves versus experimental data are also shown in Fig. 3.21.
Solution—Summary of calculation results for all four cases As can be seen from the results presented in both Table 3.14
are given in Table 3.14. For Case A all experimental data given and Fig. 3.21, a good prediction of the entire distillation curve
on the distillation curve (second column in Table 3.14) from is possible through use of only three data points at 30, 50, and
5 to 95% points are used for the regression analysis by Eq. 70%.
(3.36). Volume percentages given in the first column should be
converted to cumulative volume fraction, x, (percent values
divided by 100) and data are converted to X and Y defined in 3.3 PREDICTION OF PROPERTIES
Eq. (3.36). The first data point used in the regression process OF PETROLEUM FRACTIONS
is at x = 0.05 with T = 531.5 K; therefore, the initial guess
(T ◦ ) should be less than 531. With a few changes in T ◦ values, As discussed in Chapter 1, petroleum fractions are mixtures of
the maximum RS value of 0.9994 is obtained with minimum many hydrocarbon compounds from different families. The
AAD of 0.25 K (for the 11 data points used in the regression most accurate method to determine a property of a mixture
process). The AAD for the entire data set, including the IBP is through experimental measurement of that property. How-
and FBP, is 1.3 K. As mentioned earlier the experimentally re- ever, as this is not possible for every petroleum mixture, meth-
ported IBP and especially the value of FBP are not accurate. ods of estimation of various properties are needed by process
Therefore, larger errors for prediction of IBP and FBP are ex- or operation engineers. The most accurate method of esti-
pected from Eq. (3.35). Since values of FBP at x = 1 are not mating a property of a mixture is through knowledge of the
finite, the value of T at x = 0.99 may be used as an approx- exact composition of all components existing in the mixture.
imate predicted value of FBP from the model. These values Then properties of pure components such as those given in
are given in Table 3.14 as predicted values for each case at Tables 2.1 and 2.2 can be used together with the composi-
100 vol% vaporized. Estimated VABP from Eq. (3.37) for Case tion of the mixture and appropriate mixing rules to determine
A is 555.5 versus value of 554.7 from actual experimental data properties of the mixture. If experimental data on properties
and definition of VABP by Eq. (3.6). of pure compounds are not available, such properties should
For Case B, data from 5 to 70 vol% distilled are used for be estimated through the methods presented in Chapter 2.
the regression process and as a result the predicted values Application of this approach to defined mixtures with very
up to 70% are more accurate than values above 70% point. few constituents is practical; however, for petroleum mixtures
However, the overall error (total AAD) is the same as for Case with many constituents this approach is not feasible as the
A at 1.3 K. For Case C only three data points at 10, 30, and determination of the exact composition of all components
50% are used and as a result much larger errors especially in the mixture is not possible. For this reason appropriate
for points above 50% are observed. In Case D, data at 30, 50, models should be used to represent petroleum mixtures by
some limited number of compounds that can best represent
the mixture. These limited compounds are different from the
real compounds in the mixture and each is called a “pseudo-
650
component” or a “pseudocompound”. Determination of these
pseudocompounds and use of an appropriate model to de-
Exp. data
scribe a mixture by a certain number of pseudocompounds
Pred. (data set A) is an engineering art in prediction of properties of petroleum
Pred. (data set B) mixtures and are discussed in this section.
600 Pred. (data set C)
Temperature, K Perd. (data set D) 3.3.1 Matrix of Pseudocomponents Table
As discussed in Chapter 2, properties of hydrocarbons vary
by both carbon number and molecular type. Hydrocarbon
--`,```,`,``````,`,````,```,,-`-`,,`,,`,`,,`---
550 properties for compounds of the same carbon number vary
from paraffins to naphthenes and aromatics. Very few frac-
tions may contain olefins as well. Even within paraffins fam-
ily properties of n-paraffins differ from those of isoparaffins.
Boiling points of hydrocarbons vary strongly with carbon
number as was shown in Table 2.1; therefore, identification of
500 hydrocarbons by carbon number is useful in property predic-
0 20 40 60 80 100 tions. As discussed in Section 3.1.5.2, a combination of GS-
MS in series best separate hydrocarbons by carbon number
Vol% Distilled
and molecular type. If a mixture is separated by a distillation
FIG. 3.21—Prediction of distillation curves for the gas oil column or simulated distillation, each hydrocarbon cut with a
sample of Example 3.7. single carbon number contains hydrocarbons from different
Copyright ASTM International
Provided by IHS Markit under license with ASTM Licensee=International Dealers Demo/2222333001, User=Anggiansah, Erick
No reproduction or networking permitted without license from IHS Not for Resale, 08/26/2021 21:56:35 MDT