
Page 126 - Characterization and Properties of Petroleum Fractions - M.R. Riazi
P. 126
T1: IML
QC: IML/FFX
P2: IML/FFX
P1: IML/FFX
AT029-Manual
AT029-Manual-v7.cls
June 22, 2007
14:23
AT029-03
106 CHARACTERIZATION AND PROPERTIES OF PETROLEUM FRACTIONS
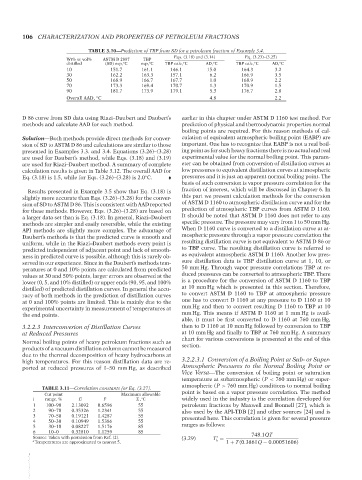
TABLE 3.10—Prediction of TBP from SD for a petroleum fraction of Example 3.4.
Eqs. (3.18) and (3.14) Eq. (3.23)–(3.25)
Wt% or vol% ASTM D 2887 TBP
distilled (SD) exp, C exp, C TBP calc, C AD, C TBP calc, C AD, C
◦
◦
◦
◦
◦
◦
10 151.7 161.1 146.1 15.0 164.3 3.2
30 162.2 163.3 157.1 6.2 166.9 3.5
50 168.9 166.7 167.7 1.0 168.9 2.2
70 173.3 169.4 170.7 1.3 170.9 1.5
90 181.7 173.9 179.1 5.3 176.7 2.8
Overall AAD, C 4.8 2.2
◦
D 86 curve from SD data using Riazi–Daubert and Daubert’s earlier in this chapter under ASTM D 1160 test method. For
methods and calculate AAD for each method. prediction of physical and thermodynamic properties normal
boiling points are required. For this reason methods of cal-
Solution—Both methods provide direct methods for conver- culation of equivalent atmospheric boiling point (EABP) are
sion of SD to ASTM D 86 and calculations are similar to those important. One has to recognize that EABP is not a real boil-
presented in Examples 3.3. and 3.4. Equations (3.26)–(3.28) ing point as for such heavy fractions there is no actual and real
are used for Daubert’s method, while Eqs. (3.18) and (3.19) experimental value for the normal boiling point. This param-
are used for Riazi–Daubert method. A summary of complete eter can be obtained from conversion of distillation curves at
calculation results is given in Table 3.12. The overall AAD for low pressures to equivalent distillation curves at atmospheric
Eq. (3.18) is 1.5, while for Eqs. (3.26)–(3.28) is 2.0 C. pressures and it is just an apparent normal boiling point. The
◦
basis of such conversion is vapor pressure correlation for the
Results presented in Example 3.5 show that Eq. (3.18) is fraction of interest, which will be discussed in Chapter 6. In
slightly more accurate than Eqs. (3.26)–(3.28) for the conver- this part we present calculation methods for the conversion
sion of SD to ASTM D 86. This is consistent with AAD reported of ASTM D 1160 to atmospheric distillation curve and for the
for these methods. However, Eqs. (3.26)–(3.28) are based on prediction of atmospheric TBP curves from ASTM D 1160.
a larger data set than is Eq. (3.18). In general, Riazi–Daubert It should be noted that ASTM D 1160 does not refer to any
methods are simpler and easily reversible, while the existing specific pressure. The pressure may vary from 1 to 50 mm Hg.
API methods are slightly more complex. The advantage of When D 1160 curve is converted to a distillation curve at at-
Daubert’s methods is that the predicted curve is smooth and mospheric pressure through a vapor pressure correlation the
uniform, while in the Riazi–Daubert methods every point is resulting distillation curve is not equivalent to ASTM D 86 or
predicted independent of adjacent point and lack of smooth- to TBP curve. The resulting distillation curve is referred to
ness in predicted curve is possible, although this is rarely ob- as equivalent atmospheric ASTM D 1160. Another low pres-
served in our experience. Since in the Daubert’s methods tem- sure distillation data is TBP distillation curve at 1, 10, or
peratures at 0 and 10% points are calculated from predicted 50 mm Hg. Through vapor pressure correlations TBP at re-
values at 30 and 50% points, larger errors are observed at the duced pressures can be converted to atmospheric TBP. There
lower (0, 5, and 10% distilled) or upper ends (90, 95, and 100% is a procedure for the conversion of ASTM D 1160 to TBP
distilled) of predicted distillation curves. In general the accu- at 10 mm Hg which is presented in this section. Therefore,
racy of both methods in the prediction of distillation curves to convert ASTM D 1160 to TBP at atmospheric pressure
at 0 and 100% points are limited. This is mainly due to the one has to convert D 1160 at any pressure to D 1160 at 10
experimental uncertainty in measurement of temperatures at mm Hg and then to convert resulting D 1160 to TBP at 10
the end points. mm Hg. This means if ASTM D 1160 at 1 mm Hg is avail-
able, it must be first converted to D 1160 at 760 mm Hg,
3.2.2.3 Interconverion of Distillation Curves then to D 1160 at 10 mm Hg followed by conversion to TBP
at Reduced Pressures at 10 mm Hg and finally to TBP at 760 mm Hg. A summary
chart for various conversions is presented at the end of this
Normal boiling points of heavy petroleum fractions such as
products of a vacuum distillation column cannot be measured section.
due to the thermal decomposition of heavy hydrocarbons at
high temperatures. For this reason distillation data are re- 3.2.2.3.1 Conversion of a Boiling Point at Sub- or Super-
ported at reduced pressures of 1–50 mm Hg, as described Atmospheric Pressures to the Normal Boiling Point or
Vice Versa—The conversion of boiling point or saturation
temperature at subatmospheric (P < 760 mm Hg) or super-
atmospheric (P > 760 mm Hg) conditions to normal boiling
TABLE 3.11—Correlation constants for Eq. (3.27).
Cut point Maximum allowable point is based on a vapor pressure correlation. The method
i range, % E F T i , C widely used in the industry is the correlation developed for
◦
1 100–90 2.13092 0.6596 55 petroleum fractions by Maxwell and Bonnell [27], which is
2 90–70 0.35326 1.2341 55 also used by the API-TDB [2] and other sources [24] and is
3 70–50 0.19121 1.4287 55 presented here. This correlation is given for several pressure
4 50–30 0.10949 1.5386 55
5 30–10 0.08227 1.5176 85 ranges as follows:
6 10–0 0.32810 1.1259 85 748.1QT
Source: Taken with permission from Ref. [2]. (3.29) T =
a Temperatures are approximated to nearest 5. b 1 + T(0.3861Q − 0.00051606)
--`,```,`,``````,`,````,```,,-`-`,,`,,`,`,,`---
Copyright ASTM International
Provided by IHS Markit under license with ASTM Licensee=International Dealers Demo/2222333001, User=Anggiansah, Erick
No reproduction or networking permitted without license from IHS Not for Resale, 08/26/2021 21:56:35 MDT