
Page 125 - Characterization and Properties of Petroleum Fractions - M.R. Riazi
P. 125
P2: IML/FFX
QC: IML/FFX
T1: IML
P1: IML/FFX
AT029-03
AT029-Manual-v7.cls
14:23
June 22, 2007
AT029-Manual
3. CHARACTERIZATION OF PETROLEUM FRACTIONS 105
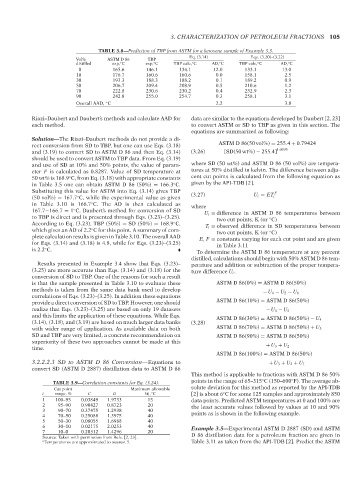
TABLE 3.8—Prediction of TBP from ASTM for a kerosene sample of Example 3.3.
Eq. (3.14) Eqs. (3.20)–(3.22)
Vol% ASTM D 86 TBP
distilled exp, C exp, C TBP calc, C AD, C TBP calc, C AD, C
◦
◦
◦
◦
◦
◦
0 165.6 146.1 134.1 12.0 133.1 13.0
10 176.7 160.6 160.6 0.0 158.1 2.5
30 193.3 188.3 188.2 0.1 189.2 0.9
50 206.7 209.4 208.9 0.5 210.6 1.2
70 222.8 230.6 230.2 0.4 232.9 2.3
90 242.8 255.0 254.7 0.3 258.1 3.1
Overall AAD, C 2.2 3.8
◦
Riazi–Daubert and Daubert’s methods and calculate AAD for data are similar to the equations developed by Daubert [2, 23]
each method. to convert ASTM or SD to TBP as given in this section. The
equations are summarized as following:
Solution—The Riazi–Daubert methods do not provide a di-
rect conversion from SD to TBP, but one can use Eqs. (3.18) ASTM D 86(50 vol%) = 255.4 + 0.79424
and (3.19) to convert SD to ASTM D 86 and then Eq. (3.14) (3.26) [SD(50 wt%) − 255.4] 1.0395
should be used to convert ASTM to TBP data. From Eq. (3.19)
and use of SD at 10% and 50% points, the value of param- where SD (50 wt%) and ASTM D 86 (50 vol%) are tempera-
eter F is calculated as 0.8287. Value of SD temperature at tures at 50% distilled in kelvin. The difference between adja-
50 wt% is 168.9 C, from Eq. (3.18) with appropriate constants cent cut points is calculated from the following equation as
◦
in Table 3.5 one can obtain ASTM D 86 (50%) = 166.3 C. given by the API-TDB [2].
◦
Substituting this value for ASTM into Eq. (3.14) gives TBP F
(50 vol%) = 167.7 C, while the experimental value as given (3.27) U i = ET i
◦
in Table 3.10 is 166.7 C. The AD is then calculated as where
◦
167.7−166.7 = 1 C. Daubert’s method for conversion of SD U i = difference in ASTM D 86 temperatures between
◦
to TBP is direct and is presented through Eqs. (3.23)–(3.25). two cut points, K (or C)
◦
According to Eq. (3.23), TBP (50%) = SD (50%) = 168.9 C, T i = observed difference in SD temperatures between
◦
which gives an AD of 2.2 C for this point. A summary of com- two cut points, K (or C)
◦
◦
plete calculation results is given in Table 3.10. The overall AAD E, F = constants varying for each cut point and are given
for Eqs. (3.14) and (3.18) is 4.8, while for Eqs. (3.23)–(3.25) in Table 3.11
is 2.2 C.
◦
To determine the ASTM D 86 temperature at any percent
distilled, calculations should begin with 50% ASTM D 86 tem-
Results presented in Example 3.4 show that Eqs. (3.23)– perature and addition or subtraction of the proper tempera-
(3.25) are more accurate than Eqs. (3.14) and (3.18) for the ture difference U i .
conversion of SD to TBP. One of the reasons for such a result
is that the sample presented in Table 3.10 to evaluate these ASTM D 86(0%) = ASTM D 86(50%)
methods is taken from the same data bank used to develop − U 4 − U 5 − U 6
correlations of Eqs. (3.23)–(3.25). In addition these equations
provide a direct conversion of SD to TBP. However, one should ASTM D 86(10%) = ASTM D 86(50%)
realize that Eqs. (3.23)–(3.25) are based on only 19 datasets − U 4 − U 5
and this limits the application of these equations. While Eqs.
ASTM D 86(30%) = ASTM D 86(50%) − U 4
(3.14), (3.18), and (3.19) are based on much larger data banks (3.28)
with wider range of application. As available data on both ASTM D 86(70%) = ASTM D 86(50%) + U 3
SD and TBP are very limited, a concrete recommendation on ASTM D 86(90%) = ASTM D 86(50%)
superiority of these two approaches cannot be made at this
time. + U 3 + U 2
ASTM D 86(100%) = ASTM D 86(50%)
3.2.2.2.3 SD to ASTM D 86 Conversion—Equations to + U 3 + U 2 + U 1
convert SD (ASTM D 2887) distillation data to ASTM D 86
This method is applicable to fractions with ASTM D 86 50%
◦
◦
TABLE 3.9—Correlation constants for Eq. (3.24). points in the range of 65–315 C (150–600 F). The average ab-
Cut point Maximum allowable solute deviation for this method as reported by the API-TDB
i range, % C D W i , C [2] is about 6 C for some 125 samples and approximately 850
◦
◦
1 100–95 0.03849 1.9733 15 data points. Predicted ASTM temperatures at 0 and 100% are
2 95–90 0.90427 0.8723 20 the least accurate values followed by values at 10 and 90%
3 90–70 0.37475 1.2938 40
4 70–50 0.25088 1.3975 40 points as is shown in the following example.
5 50–30 0.08055 1.6988 40
6 30–10 0.02175 2.0253 40 Example 3.5—Experimental ASTM D 2887 (SD) and ASTM
7 10–0 0.20312 1.4296 20
Source: Taken with permission from Refs. [2, 23]. D 86 distillation data for a petroleum fraction are given in
a Temperatures are approximated to nearest 5. Table 3.11 as taken from the API-TDB [2]. Predict the ASTM
--`,```,`,``````,`,````,```,,-`-`,,`,,`,`,,`---
Copyright ASTM International
Provided by IHS Markit under license with ASTM Licensee=International Dealers Demo/2222333001, User=Anggiansah, Erick
No reproduction or networking permitted without license from IHS Not for Resale, 08/26/2021 21:56:35 MDT