
Page 127 - Characterization and Properties of Petroleum Fractions - M.R. Riazi
P. 127
QC: IML/FFX
T1: IML
P1: IML/FFX
P2: IML/FFX
AT029-Manual-v7.cls
June 22, 2007
14:23
AT029-Manual
AT029-03
3. CHARACTERIZATION OF PETROLEUM FRACTIONS 107
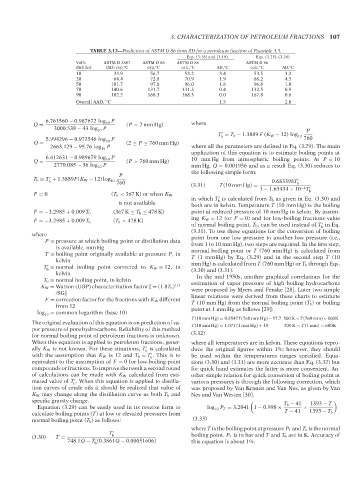
TABLE 3.12—Prediction of ASTM D 86 from SD for a petroleum fraction of Example 3.5.
Eqs. (3.18) and (3.19) Eqs. (3.25)–(3.28)
Vol% ASTM D 2887 ASTM D 86 ASTM D 86 ASTM D 86
distilled (SD) exp, C exp, C calc, C AD, C calc, C AD, C
◦
◦
◦
◦
◦
◦
10 33.9 56.7 53.2 3.4 53.5 3.2
30 64.4 72.8 70.9 1.9 68.2 4.5
50 101.7 97.8 96.0 1.8 96.8 1.0
70 140.6 131.7 131.3 0.4 132.5 0.9
90 182.2 168.3 168.3 0.0 167.8 0.6
Overall AAD, C 1.5 2.0
◦
6.761560 − 0.987672 log 10 P
Q = (P < 2 mm Hg) where
3000.538 − 43 log 10 P P
T = T b − 1.3889 F (K W − 12) log 10
b
5.994296 − 0.972546 log 10 P 760
Q = (2 ≤ P ≤ 760 mm Hg)
2663.129 − 95.76 log P where all the parameters are defined in Eq. (3.29). The main
10
application of this equation is to estimate boiling points at
6.412631 − 0.989679 log 10 P 10 mm Hg from atmospheric boiling points. At P = 10
Q = (P > 760 mm Hg)
2770.085 − 36 log P mm Hg, Q = 0.001956 and as a result Eq. (3.30) reduces to
10
the following simple form:
P
T b = T + 1.3889F(K W − 12) log
b 10 760 0.683398T
(3.31) T(10 mm Hg) = b
−4
1 − 1.63434 × 10 T b
F = 0 (T b < 367 K) or when K W
in which T is calculated from T b as given in Eq. (3.30) and
b
is not available
both are in kelvin. Temperature T (10 mm Hg) is the boiling
(367 K ≤ T b ≤ 478 K) point at reduced pressure of 10 mm Hg in kelvin. By assum-
F =−3.2985 + 0.009 T b
ing K W = 12 (or F = 0) and for low-boiling fractions value
(T b > 478 K)
F =−3.2985 + 0.009 T b
of normal boiling point, T b , can be used instead of T in Eq.
b
(3.31). To use these equations for the conversion of boiling
where point from one low pressure to another low pressure (i.e.,
P = pressure at which boiling point or distillation data from 1 to 10 mm Hg), two steps are required. In the first step,
is available, mm Hg normal boiling point or T (760 mm Hg) is calculated from
T = boiling point originally available at pressure P,in T (1 mm Hg) by Eq. (3.29) and in the second step T (10
kelvin mm Hg) is calculated from T (760 mm Hg) or T b through Eqs.
T = normal boiling point corrected to K W = 12, in
b (3.30) and (3.31).
kelvin In the mid 1950s, another graphical correlations for the
T b = normal boiling point, in kelvin estimation of vapor pressure of high boiling hydrocarbons
K W = Watson (UOP) characterization factor [ = (1.8T b ) 1/3 were proposed by Myers and Fenske [28]. Later two simple
/SG] linear relations were derived from these charts to estimate
F = correction factor for the fractions with K W different T (10 mm Hg) from the normal boiling point (T b ) or boiling
from 12 point at 1 mm Hg as follows [29]:
log 10 = common logarithm (base 10)
T(10 mm Hg) = 0.8547T(760 mm Hg) − 57.7 500 K < T(760 mm) < 800K
The original evaluation of this equation is on prediction of va- T(10 mm Hg) = 1.07T(1 mm Hg) + 19 300 K < T(1 mm) < 600K
por pressure of pure hydrocarbons. Reliability of this method
for normal boiling point of petroleum fractions is unknown. (3.32)
When this equation is applied to petroleum fractions, gener- where all temperatures are in kelvin. These equations repro-
ally K W is not known. For these situations, T is calculated duce the original figures within 1%; however, they should
b
with the assumption that K W is 12 and T b = T . This is to be used within the temperatures ranges specified. Equa-
b
equivalent to the assumption of F = 0 for low-boiling-point tions (3.30) and (3.31) are more accurate than Eq. (3.32) but
compounds or fractions. To improve the result a second round for quick hand estimates the latter is more convenient. An-
of calculations can be made with K W calculated from esti- other simple relation for quick conversion of boiling point at
mated value of T . When this equation is applied to distilla- various pressures is through the following correction, which
b
tion curves of crude oils it should be realized that value of was proposed by Van Kranen and Van Nes, as given by Van
K W may change along the distillation curve as both T b and Nes and Van Westen [30].
specific gravity change. T b − 41 1393 − T
Equation (3.29) can be easily used in its reverse form to log 10 P T = 3.2041 1 − 0.998 × ×
calculate boiling points (T) at low or elevated pressures from T − 41 1393 − T b
normal boiling point (T b ) as follows: (3.33)
where T is the boiling point at pressure P T and T b is the normal
T
(3.30) T = b boiling point. P T is in bar and T and T b are in K. Accuracy of
748.1Q − T (0.3861Q − 0.00051606) this equation is about 1%.
b
--`,```,`,``````,`,````,```,,-`-`,,`,,`,`,,`---
Copyright ASTM International
Provided by IHS Markit under license with ASTM Licensee=International Dealers Demo/2222333001, User=Anggiansah, Erick
No reproduction or networking permitted without license from IHS Not for Resale, 08/26/2021 21:56:35 MDT