
Page 124 - Characterization and Properties of Petroleum Fractions - M.R. Riazi
P. 124
P2: IML/FFX
T1: IML
QC: IML/FFX
P1: IML/FFX
14:23
AT029-Manual
AT029-Manual-v7.cls
June 22, 2007
AT029-03
104 CHARACTERIZATION AND PROPERTIES OF PETROLEUM FRACTIONS
(3.22). The summary of results is given in Table 3.8. The
300
overall average absolute deviations (AAD) for Eqs. (3.14) and
◦
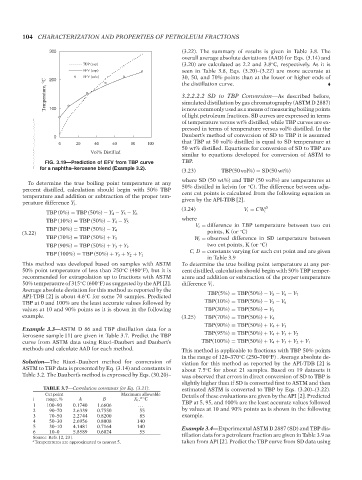
TBP (exp) (3.20) are calculated as 2.2 and 3.8 C, respectively. As it is
EFV (exp) seen in Table 3.8, Eqs. (3.20)–(3.22) are more accurate at
EFV (calc) 30, 50, and 70% points than at the lower or higher ends of
200
Temperature, °C 3.2.2.2.2 SD to TBP Conversion—As described before,
the distillation curve.
simulated distillation by gas chromatography (ASTM D 2887)
is now commonly used as a means of measuring boiling points
100
of light petroleum fractions. SD curves are expressed in terms
of temperature versus wt% distilled, while TBP curves are ex-
pressed in terms of temperature versus vol% distilled. In the
0 Daubert’s method of conversion of SD to TBP it is assumed
that TBP at 50 vol% distilled is equal to SD temperature at
0 20 40 60 80 100
50 wt% distilled. Equations for conversion of SD to TBP are
Vol% Distilled
similar to equations developed for conversion of ASTM to
FIG. 3.19—Prediction of EFV from TBP curve TBP.
for a naphtha–kerosene blend (Example 3.2).
(3.23) TBP(50 vol%) = SD(50 wt%)
--`,```,`,``````,`,````,```,,-`-`,,`,,`,`,,`---
where SD (50 wt%) and TBP (50 vol%) are temperatures at
To determine the true boiling point temperature at any 50% distilled in kelvin (or C). The difference between adja-
◦
percent distilled, calculation should begin with 50% TBP cent cut points is calculated from the following equation as
temperature and addition or subtraction of the proper tem- given by the API-TDB [2].
perature difference Y i .
(3.24) V i = CW i D
TBP (0%) = TBP (50%) − Y 4 − Y 5 − Y 6
where
TBP (10%) = TBP (50%) − Y 4 − Y 5
V i = difference in TBP temperature between two cut
TBP (30%) = TBP (50%) − Y 4 points, K (or C)
◦
(3.22)
W i = observed difference in SD temperature between
TBP (70%) = TBP (50%) + Y 3
two cut points, K (or C)
◦
TBP (90%) = TBP (50%) + Y 3 + Y 2
C, D = constants varying for each cut point and are given
TBP (100%) = TBP (50%) + Y 3 + Y 2 + Y 1
in Table 3.9
This method was developed based on samples with ASTM To determine the true boiling point temperature at any per-
50% point temperature of less than 250 C (480 F), but it is cent distilled, calculation should begin with 50% TBP temper-
◦
◦
recommended for extrapolation up to fractions with ASTM ature and addition or subtraction of the proper temperature
50% temperature of 315 C (600 F) as suggested by the API [2]. difference V i .
◦
◦
Average absolute deviation for this method as reported by the
API-TDB [2] is about 4.6 C for some 70 samples. Predicted TBP(5%) = TBP(50%) − V 5 − V 6 − V 7
◦
TBP at 0 and 100% are the least accurate values followed by TBP(10%) = TBP(50%) − V 5 − V 6
values at 10 and 90% points as it is shown in the following TBP(30%) = TBP(50%) − V 5
example. (3.25) TBP(70%) = TBP(50%) + V 4
TBP(90%) = TBP(50%) + V 4 + V 3
Example 3.3—ASTM D 86 and TBP distillation data for a
kerosene sample [1] are given in Table 3.7. Predict the TBP TBP(95%) = TBP(50%) + V 4 + V 3 + V 2
curve from ASTM data using Riazi–Daubert and Daubert’s TBP(100%) = TBP(50%) + V 4 + V 3 + V 2 + V 1
methods and calculate AAD for each method. This method is applicable to fractions with TBP 50% points
in the range of 120–370 C (250–700 F) . Average absolute de-
◦
◦
Solution—The Riazi–Daubert method for conversion of viation for this method as reported by the API-TDB [2] is
ASTM to TBP data is presented by Eq. (3.14) and constants in about 7.5 C for about 21 samples. Based on 19 datasets it
◦
Table 3.2. The Daubert’s method is expressed by Eqs. (30.20)– was observed that errors in direct conversion of SD to TBP is
slightly higher than if SD is converted first to ASTM and then
TABLE 3.7—Correlation constants for Eq. (3.21). estimated ASTM is converted to TBP by Eqs. (3.20)–(3.22).
Cut point Maximum allowable Details of these evaluations are given by the API [2]. Predicted
i range, % A B X i , C
a◦
1 100–90 0.1740 1.6606 . . . TBP at 5, 95, and 100% are the least accurate values followed
2 90–70 2.6339 0.7550 55 by values at 10 and 90% points as is shown in the following
3 70–50 2.2744 0.8200 85 example.
4 50–30 2.6956 0.8008 140
5 30–10 4.1481 0.7164 140 Example 3.4—Experimental ASTM D 2887 (SD) and TBP dis-
6 10–0 5.8589 0.6024 55
Source: Refs. [2, 23]. tillation data for a petroleum fraction are given in Table 3.9 as
a Temperatures are approximated to nearest 5. taken from API [2]. Predict the TBP curve from SD data using
Copyright ASTM International
Provided by IHS Markit under license with ASTM Licensee=International Dealers Demo/2222333001, User=Anggiansah, Erick
No reproduction or networking permitted without license from IHS Not for Resale, 08/26/2021 21:56:35 MDT