
Page 150 - Characterization and Properties of Petroleum Fractions - M.R. Riazi
P. 150
QC: IML/FFX
T1: IML
P1: IML/FFX
P2: IML/FFX
June 22, 2007
14:23
AT029-Manual-v7.cls
AT029-Manual
AT029-03
130 CHARACTERIZATION AND PROPERTIES OF PETROLEUM FRACTIONS
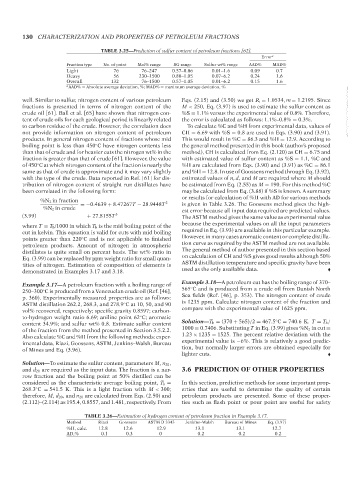
TABLE 3.25—Prediction of sulfur content of petroleum fractions [62].
Error a
Fraction type No. of point Mol% range SG range Sulfur wt% range AAD% MAD%
Light 76 76–247 0.57–0.86 0.01–1.6 0.09 0.7
Heavy 56 230–1500 0.80–1.05 0.07–6.2 0.24 1.6
Overall 132 76–1500 0.57–1.05 0.01–6.2 0.15 1.6
a AAD% = Absolute average deviation, %; MAD% = maximum average deviation, %.
well. Similar to sulfur, nitrogen content of various petroleum Eqs. (2.15) and (3.50) we get R i = 1.0534, m = 1.2195. Since
fractions is presented in terms of nitrogen content of the M < 250, Eq. (3.97) is used to estimate the sulfur content as
crude oil [61]. Ball et al. [65] have shown that nitrogen con- %S = 1.1% versus the experimental value of 0.8%. Therefore, --`,```,`,``````,`,````,```,,-`-`,,`,,`,`,,`---
tent of crude oils for each geological period is linearly related the error is calculated as follows: 1.1%–0.8% = 0.3%.
to carbon residue of the crude. However, the correlation does To calculate %C and %H from experimental data, values of
not provide information on nitrogen content of petroleum CH = 6.69 with %S = 0.8 are used in Eqs. (3.90) and (3.91).
products. In general nitrogen content of fractions whose mid This would result in %C = 86.3 and %H = 12.9. According to
boiling point is less than 450 C have nitrogen contents less the general method presented in this book (author’s proposed
◦
than that of crude and for heavier cuts the nitrogen wt% in the method), CH is calculated from Eq. (2.120) as CH = 6.75 and
fraction is greater than that of crude [61]. However, the value with estimated value of sulfur content as %S = 1.1, %C and
of 450 C at which nitrogen content of the fraction is nearly the %H are calculated from Eqs. (3.90) and (3.91) as %C = 86.1
◦
same as that of crude is approximate and it may vary slightly and %H = 12.8. In use of Goossens method through Eq. (3.92),
with the type of the crude. Data reported in Ref. [61] for dis- estimated values of n, d, and M are required where M should
tribution of nitrogen content of straight run distillates have be estimated from Eq. (2.55) as M = 190. For this method %C
been correlated in the following form: may be calculated from Eq. (3.88) if %S is known. A summary
or results for calculation of %H with AD for various methods
%N 2 in fraction =−0.4639 + 8.47267T − 28.9448T 2 is given in Table 3.26. The Goossens method gives the high-
%N 2 in crude est error because all input data required are predicted values.
(3.99) + 27.8155T 3 The ASTM method gives the same value as experimental value
because the experimental values on all the input parameters
where T = T b /1000 in which T b is the mid boiling point of the
cut in kelvin. This equation is valid for cuts with mid boiling required in Eq. (3.93) are available in this particular example.
points greater than 220 C and is not applicable to finished However, in many cases aromatic content or complete distilla-
◦
petroleum products. Amount of nitrogen in atmospheric tion curve as required by the ASTM method are not available.
distillates is quite small on percent basis. The wt% ratio in The general method of author presented in this section based
Eq. (3.99) can be replaced by ppm weight ratio for small quan- on calculation of CH and %S gives good results although 50%
tities of nitrogen. Estimation of composition of elements is ASTM distillation temperature and specific gravity have been
demonstrated in Examples 3.17 and 3.18. used as the only available data.
Example 3.18—A petroleum cut has the boiling range of 370–
Example 3.17—A petroleum fraction with a boiling range of
◦
250–300 C is produced from a Venezuelan crude oil (Ref. [46], 565 C and is produced from a crude oil from Danish North
◦
p. 360). Experimentally measured properties are as follows: Sea fields (Ref. [46], p. 353). The nitrogen content of crude
ASTM distillation 262.2, 268.3, and 278.9 C at 10, 50, and 90 is 1235 ppm. Calculate nitrogen content of the fraction and
◦
vol% recovered, respectively; specific gravity 0.8597; carbon- compare with the experimental value of 1625 ppm.
to-hydrogen weight ratio 6.69; aniline point 62 C; aromatic
◦
◦
content 34.9%; and sulfur wt% 0.8. Estimate sulfur content Solution—T b = (370 + 565)/2 = 467.5 C = 740.6K. T = T b /
of the fraction from the method presented in Section 3.5.2.2. 1000 = 0.7406. Substituting T in Eq. (3.99) gives %N 2 in cut =
Also calculate %C and %H from the following methods: exper- 1.23 × 1235 = 1525. The percent relative deviation with the
imental data, Riazi, Goossens, ASTM, Jenkins–Walsh, Bureau experimental value is −6%. This is relatively a good predic-
of Mines and Eq. (3.96). tion, but normally larger errors are obtained especially for
lighter cuts.
Solution—To estimate the sulfur content, parameters M, n 20 ,
and d 20 are required as the input data. The fraction is a nar- 3.6 PREDICTION OF OTHER PROPERTIES
row fraction and the boiling point at 50% distilled can be
considered as the characteristic average boiling point, T b = In this section, predictive methods for some important prop-
268.3 C = 541.5 K. This is a light fraction with M < 300; erties that are useful to determine the quality of certain
◦
therefore, M, d 20 , and n 20 are calculated from Eqs. (2.50) and petroleum products are presented. Some of these proper-
(2.112)–(2.114) as 195.4, 0.8557, and 1.481, respectively. From ties such as flash point or pour point are useful for safety
TABLE 3.26—Estimation of hydrogen content of petroleum fraction in Example 3.17.
Method Riazi Goossens ASTM D 3343 Jenkins–Walsh Bureau of Mines Eq. (3.97)
%H, calc. 12.8 12.6 12.9 13.1 13.1 12.7
AD,% 0.1 0.3 0 0.2 0.2 0.2
Copyright ASTM International
Provided by IHS Markit under license with ASTM Licensee=International Dealers Demo/2222333001, User=Anggiansah, Erick
No reproduction or networking permitted without license from IHS Not for Resale, 08/26/2021 21:56:35 MDT