
Page 154 - Characterization and Properties of Petroleum Fractions - M.R. Riazi
P. 154
QC: IML/FFX
P2: IML/FFX
T1: IML
P1: IML/FFX
AT029-Manual
AT029-Manual-v7.cls
June 22, 2007
14:23
AT029-03
134 CHARACTERIZATION AND PROPERTIES OF PETROLEUM FRACTIONS
--`,```,`,``````,`,````,```,,-`-`,,`,,`,`,,`---
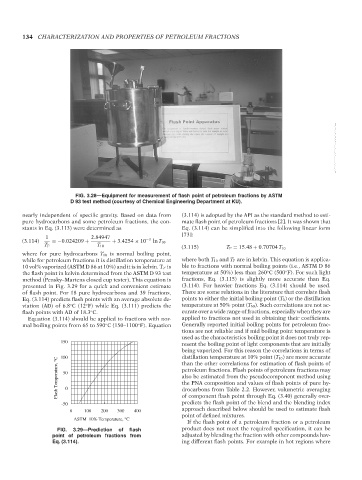
FIG. 3.28—Equipment for measurement of flash point of petroleum fractions by ASTM
D 93 test method (courtesy of Chemical Engineering Department at KU).
nearly independent of specific gravity. Based on data from (3.114) is adopted by the API as the standard method to esti-
pure hydrocarbons and some petroleum fractions, the con- mate flash point of petroleum fractions [2]. It was shown that
stants in Eq. (3.113) were determined as Eq. (3.114) can be simplified into the following linear form
[73]:
1 2.84947
(3.114) =−0.024209 + + 3.4254 × 10 −3 ln T 10
T F T 10 (3.115) T F = 15.48 + 0.70704 T 10
where for pure hydrocarbons T 10 is normal boiling point,
while for petroleum fractions it is distillation temperature at where both T 10 and T F are in kelvin. This equation is applica-
10 vol% vaporized (ASTM D 86 at 10%) and it is in kelvin. T F is ble to fractions with normal boiling points (i.e., ASTM D 86
the flash point in kelvin determined from the ASTM D 93 test temperature at 50%) less than 260 C (500 F). For such light
◦
◦
method (Pensky–Martens closed cup tester). This equation is fractions, Eq. (3.115) is slightly more accurate than Eq.
presented in Fig. 3.29 for a quick and convenient estimate (3.114). For heavier fractions Eq. (3.114) should be used.
of flash point. For 18 pure hydrocarbons and 39 fractions, There are some relations in the literature that correlate flash
Eq. (3.114) predicts flash points with an average absolute de- points to either the initial boiling point (T 0 ) or the distillation
viation (AD) of 6.8 C (12 F) while Eq. (3.111) predicts the temperature at 50% point (T 50 ). Such correlations are not ac-
◦
◦
flash points with AD of 18.3 C. curate over a wide range of fractions, especially when they are
◦
Equation (3.114) should be applied to fractions with nor- applied to fractions not used in obtaining their coefficients.
mal boiling points from 65 to 590 C (150–1100 F). Equation Generally reported initial boiling points for petroleum frac-
◦
◦
tions are not reliable and if mid boiling point temperature is
used as the characteristics boiling point it does not truly rep-
150
resent the boiling point of light components that are initially
being vaporized. For this reason the correlations in terms of
distillation temperature at 10% point (T 10 ) are more accurate
100
Flash Temperature, °C 50 0 petroleum fractions. Flash points of petroleum fractions may
than the other correlations for estimation of flash points of
also be estimated from the pseudocomponent method using
the PNA composition and values of flash points of pure hy-
drocarbons from Table 2.2. However, volumetric averaging
predicts the flash point of the blend and the blending index
-50 of component flash point through Eq. (3.40) generally over-
approach described below should be used to estimate flash
0 100 200 300 400
point of defined mixtures.
ASTM 10% Temperature, °C
If the flash point of a petroleum fraction or a petroleum
FIG. 3.29—Prediction of flash product does not meet the required specification, it can be
point of petroleum fractions from adjusted by blending the fraction with other compounds hav-
Eq. (3.114). ing different flash points. For example in hot regions where
Copyright ASTM International
Provided by IHS Markit under license with ASTM Licensee=International Dealers Demo/2222333001, User=Anggiansah, Erick
No reproduction or networking permitted without license from IHS Not for Resale, 08/26/2021 21:56:35 MDT