
Page 156 - Characterization and Properties of Petroleum Fractions - M.R. Riazi
P. 156
QC: IML/FFX
P2: IML/FFX
P1: IML/FFX
June 22, 2007
AT029-03
14:23
AT029-Manual
AT029-Manual-v7.cls
136 CHARACTERIZATION AND PROPERTIES OF PETROLEUM FRACTIONS
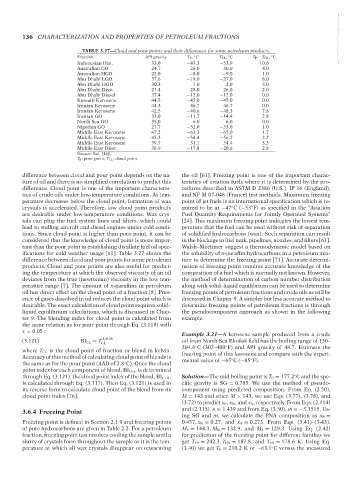
TABLE 3.27—Cloud and pour points and their differences for some petroleum products.
Fraction T1: IML API gravity T P , C T CL , C T P − T CL , C --`,```,`,``````,`,````,```,,-`-`,,`,,`,`,,`---
◦
◦
◦
Indonesian Dist. 33.0 −43.3 −53.9 10.6
Australian GO 24.7 −26.0 −30.0 4.0
Australian HGO 22.0 −8.0 −9.0 1.0
Abu Dhabi LGO 37.6 −19.0 −27.0 8.0
Abu Dhabi HGO 30.3 7.0 2.0 5.0
Abu Dhabi Disst. 21.4 28.0 26.0 2.0
Abu Dhabi Diesel 37.4 −12.0 −12.0 0.0
Kuwaiti Kerosene 44.5 −45.0 −45.0 0.0
Iranian Kerosene 44.3 −46.7 −46.7 0.0
Iranian Kerosene 42.5 −40.6 −48.3 7.8
Iranian GO 33.0 −11.7 −14.4 2.8
North Sea GO 35.0 6.0 6.0 0.0
Nigerian GO 27.7 −32.0 −33.0 1.0
Middle East Kerosene 47.2 −63.3 −65.0 1.7
Middle East Kerosene 45.3 −54.4 −56.7 2.2
Middle East Kerosene 39.7 −31.1 −34.4 3.3
Middle East Disst. 38.9 −17.8 −20.6 2.8
Source: Ref. [46].
T P : pour point; T CL : cloud point.
difference between cloud and pour point depends on the na- the oil [61]. Freezing point is one of the important charac-
ture of oil and there is no simplified correlation to predict this teristics of aviation fuels where it is determined by the pro-
difference. Cloud point is one of the important characteris- cedures described in ASTM D 2386 (U.S.), IP 16 (England),
tics of crude oils under low-temperature conditions. As tem- and NF M 07-048 (France) test methods. Maximum freezing
perature decreases below the cloud point, formation of wax point of jet fuels is an international specification which is re-
crystals is accelerated. Therefore, low cloud point products quired to be at −47 C(−53 F) as specified in the “Aviation
◦
◦
are desirable under low-temperature conditions. Wax crys- Fuel Quantity Requirements for Jointly Operated Systems”
tals can plug the fuel system lines and filters, which could [24]. This maximum freezing point indicates the lowest tem-
lead to stalling aircraft and diesel engines under cold condi- perature that the fuel can be used without risk of separation
tions. Since cloud point is higher than pour point, it can be of solidified hydrocarbons (wax). Such separation can result
considered that the knowledge of cloud point is more impor- in the blockage in fuel tank, pipelines, nozzles, and filters [61].
tant than the pour point in establishing distillate fuel oil spec- Walsh–Mortimer suggest a thermodynamic model based on
ifications for cold weather usage [61]. Table 3.27 shows the the solubility of n-paraffin hydrocarbons in a petroleum mix-
difference between cloud and pour points for some petroleum ture to determine the freezing point [71]. Accurate determi-
products. Cloud and pour points are also useful for predict- nation of freezing point requires accurate knowledge of the
ing the temperature at which the observed viscosity of an oil composition of a fuel which is normally not known. However,
deviates from the true (newtonian) viscosity in the low tem- the method of determination of carbon number distribution
perature range [7]. The amount of n-paraffins in petroleum along with solid–liquid equilibrium can be used to determine
oil has direct effect on the cloud point of a fraction [8]. Pres- freezing points of petroleum fractions and crude oils as will be
ence of gases dissolved in oil reduces the cloud point which is discussed in Chapter 9. A simpler but less accurate method to
desirable. The exact calculation of cloud point requires solid– determine freezing points of petroleum fractions is through
liquid equilibrium calculations, which is discussed in Chap- the pseudocomponent approach as shown in the following
ter 9. The blending index for cloud point is calculated from example.
the same relation as for pour point through Eq. (3.118) with
x = 0.05 :
Example 3.21—A kerosene sample produced from a crude
1/0.05
(3.121) BI CL = T CL oil from North Sea Ekofisk field has the boiling range of 150–
204.4 C (302–400 F) and API gravity of 48.7. Estimate the
◦
◦
where T CL is the cloud point of fraction or blend in kelvin. freezing point of this kerosene and compare with the experi-
Accuracy of this method of calculating cloud point of blends is mental value of −65 C(−85 F).
◦
◦
the same as for the pour point (AAD of 2.8 C). Once the cloud
◦
point index for each component of blend, BI CLi , is determined
through Eq. (3.121), the cloud point index of the blend, BI CLB , Solution—The mid boiling point is T b = 177.2 C and the spe-
◦
is calculated through Eq. (3.117). Then Eq. (3.121) is used in cific gravity is SG = 0.785. We use the method of pseudo-
its reverse form to calculate cloud point of the blend from its component using predicted composition. From Eq. (2.50),
cloud point index [76]. M = 143 and since M > 143, we use Eqs. (3.77), (3.78), and
(3.72) to predict x P , x N , and x A , respectively. From Eqs. (2.114)
3.6.4 Freezing Point and (2.115), n = 1.439 and from Eq. (3.50), m =−5.1515. Us-
ing SG and m, we calculate the PNA composition as x P =
Freezing point is defined in Section 2.1.9 and freezing points 0.457, x N = 0.27, and x A = 0.273. From Eqs. (3.41)–(3-43),
of pure hydrocarbons are given in Table 2.2. For a petroleum M P = 144.3, M N = 132.9, and M A = 129.3. Using Eq. (2.42)
fraction, freezing point test involves cooling the sample until a for prediction of the freezing point for different families we
slurry of crystals form throughout the sample or it is the tem- get T FP = 242.3, T FN = 187.8, and T FA = 178.6 K. Using Eq.
perature at which all wax crystals disappear on rewarming (3.40) we get T F = 210.2Kor −63.1 C versus the measured
◦
Copyright ASTM International
Provided by IHS Markit under license with ASTM Licensee=International Dealers Demo/2222333001, User=Anggiansah, Erick
No reproduction or networking permitted without license from IHS Not for Resale, 08/26/2021 21:56:35 MDT