
Page 174 - Characterization and Properties of Petroleum Fractions - M.R. Riazi
P. 174
T1: IML
QC: —/—
P2: KVU/KXT
P1: KVU/KXT
AT029-Manual
AT029-Manual-v7.cls
AT029-04
June 22, 2007
21:30
154 CHARACTERIZATION AND PROPERTIES OF PETROLEUM FRACTIONS
TABLE 4.1—Composition of several reservoir fluids.
North Sea gas condensate North Sea oil Texas gas condensate Texas oil
Component mol% SG M mol% SG M mol% SG M mol% SG M
N 2 0.85 0.69 0 0
CO 2 0.65 3.14 0 0
C 1 83.58 52.81 91.35 52.00
C 2 5.95 8.87 4.03 3.81
C 3 2.91 6.28 1.53 2.37
IC 4 0.45 1.06 0.39 0.76
nC 4 1.11 2.48 0.43 0.96
IC 5 0.36 0.87 0.15 0.69
nC 5 0.48 1.17 0.19 0.51
C 6 0.60 1.45 0.39 2.06
C 7 0.80 0.7243 95 2.39 0.741 91.7 0.361 0.745 100 2.63 0.749 99
C 8 0.76 0.7476 103 2.67 0.767 104.7 0.285 0.753 114 2.34 0.758 110
C 9 0.47 0.7764 116 1.83 0.787 119.2 0.222 0.773 128 2.35 0.779 121
1.03 0.8120 167 14.29 0.869 259.0 0.672 0.814 179 29.52 0.852 221
C 10+
3.06 0.7745 124 21.18 0.850 208.6 1.54 0.787 141.1 36.84 0.841 198.9
C 7+
--`,```,`,``````,`,````,```,,-`-`,,`,,`,`,,`---
Source: North Sea gas condensate and oil samples are taken from Ref. [1]. South West Texas gas condensate and oil samples are
taken from Ref. [2]. Data for C 7+ have been obtained from data on C 7 ,C 8 ,C 9 ,andC 10+ components.
boiling point cannot be measured; only molecular weight and Generation of such data for molecular weight and den-
specific gravity are available for the plus fractions. Character- sity distribution from gas chromatography (GC) analysis for
istics and properties of SCN groups are given later in this crude oils is shown by Osjord et al. [3]. Detailed composi-
chapter (Section 4.3). tion of SCN groups for C 6+ or C 7+ fractions can also be ob-
tained by TBP distillation. Experimental data obtained from
distillation are the most accurate way of analyzing a reser-
voir fluid or crude oil, especially when it is combined with
measuring specific gravity of each cut. However, GC analysis
requires smaller sample quantity, less time, and less cost than
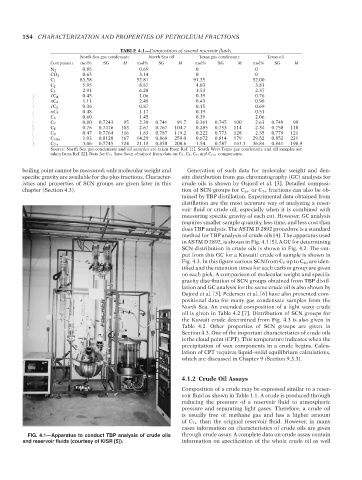
does TBP analysis. The ASTM D 2892 procedure is a standard
method for TBP analysis of crude oils [4]. The apparatus used
in ASTM D 2892, is shown in Fig. 4.1 [5]. A GC for determining
SCN distribution in crude oils is shown in Fig. 4.2. The out-
put from this GC for a Kuwaiti crude oil sample is shown in
Fig. 4.3. In this figure various SCN from C 5 up to C 40 are iden-
tified and the retention times for each carbon group are given
on each pick. A comparison of molecular weight and specific
gravity distribution of SCN groups obtained from TBP distil-
lation and GC analysis for the same crude oil is also shown by
Osjord et al. [3]. Pedersen et al. [6] have also presented com-
positional data for many gas condensate samples from the
North Sea. An extended composition of a light waxy crude
oil is given in Table 4.2 [7]. Distribution of SCN groups for
the Kuwait crude determined from Fig. 4.3 is also given in
Table 4.2. Other properties of SCN groups are given in
Section 4.3. One of the important characteristics of crude oils
is the cloud point (CPT). This temperature indicates when the
precipitation of wax components in a crude begins. Calcu-
lation of CPT requires liquid–solid equilibrium calculations,
which are discussed in Chapter 9 (Section 9.3.3).
4.1.2 Crude Oil Assays
Composition of a crude may be expressed similar to a reser-
voir fluid as shown in Table 1.1. A crude is produced through
reducing the pressure of a reservoir fluid to atmospheric
pressure and separating light gases. Therefore, a crude oil
is usually free of methane gas and has a higher amount
of C 7+ than the original reservoir fluid. However, in many
cases information on characteristics of crude oils are given
FIG. 4.1—Apparatus to conduct TBP analysis of crude oils through crude assay. A complete data on crude assay contain
and reservoir fluids (courtesy of KISR [5]). information on specification of the whole crude oil as well
Copyright ASTM International
Provided by IHS Markit under license with ASTM Licensee=International Dealers Demo/2222333001, User=Anggiansah, Erick
No reproduction or networking permitted without license from IHS Not for Resale, 08/26/2021 21:56:35 MDT