
Page 200 - Characterization and Properties of Petroleum Fractions - M.R. Riazi
P. 200
QC: —/—
P2: KVU/KXT
P1: KVU/KXT
T1: IML
June 22, 2007
AT029-Manual
AT029-04
21:30
AT029-Manual-v7.cls
180 CHARACTERIZATION AND PROPERTIES OF PETROLEUM FRACTIONS
TABLE 4.15—Evaluation of various distribution models for estimation of mixture
average properties of C 7+ fractions for 68 mixtures of Table 4.14. a
Generalized model, Eq. (4.56)
Gamma distribution
Two-parameter model Three-parameter model model, Eq. (4.31)
Property AAD b %AAD b AAD %AAD AAD %AAD
M 12.58 6.8 11.9 6.4 5.4 2.9
SG 0.003 0.35 0.003 0.35 c c
n 20 0.003 d 0.2 0.003 0.2 c c
a M 7+ range: 120–290. SG 7+ range: 0.76–0.905.
b Defined in Table 4.14.
c The gamma model cannot be applied to SG or n 20 .
d For 13 oil samples.
TABLE 4.16—Prediction of distribution of refractive index of a C 6+ fraction from Eq. (4.56).
N C Vol% n 20 x cv I I, pred. n 20 , pred. %AD
6 2.50 1.3866 0.013 0.2352 0.2357 1.3875 0.06
7 5.47 1.4102 0.056 0.2479 0.2467 1.4080 0.16
8 4.53 1.4191 0.109 0.2526 0.2542 1.4222 0.22
9 5.06 1.4327 0.161 0.2597 0.2596 1.4324 0.02
10 2.55 1.4407 0.201 0.2639 0.2632 1.4393 0.09
11 3.62 1.4389 0.234 0.2630 0.2659 1.4445 0.39
12 3.70 1.4472 0.274 0.2673 0.2688 1.4502 0.20
13 4.19 1.4556 0.316 0.2716 0.2718 1.4560 0.03
14 3.73 1.4615 0.358 0.2747 0.2747 1.4615 0.00
15 3.96 1.4694 0.399 0.2787 0.2774 1.4668 0.18
16 3.03 1.4737 0.437 0.2809 0.2798 1.4715 0.15
17 3.40 1.4745 0.471 0.2813 0.2819 1.4758 0.09
18 3.13 1.4755 0.506 0.2818 0.2842 1.4802 0.31
19 2.94 1.4808 0.538 0.2845 0.2862 1.4842 0.23
20+ 41.70 1.5224 0.777 0.3052 0.3031 1.5182 0.28
Mixture 93.51 0.14
Experimental data on n 20 are taken from Berge [42].
†
method can be used to predict distribution of refractive index predicted with B = 3 with an accuracy of 0.2% as shown in
of a C 6+ fraction. Table 4.14. As discussed in Chapter 2, parameter I is a size pa-
rameter similar to density or specific gravity and therefore the
Example 4.11—For a C 6+ of an oil sample experimental data average for a mixture should be calculated through Eq. (4.76)
on refractive index at 20 C are given versus vol% of SCN or (4.80).
◦
groups from C 6 to C 20+ in Table 4.16. Refractive index of the
whole fraction is 1.483. Use Eq. (4.56) to predict refractive
index distribution and obtain the AAD% for the model pre-
diction. Also graphically compare the model prediction with
the experimental data and calculate the mixture refractive
index.
Solution—Similar to Example 4.7, vol% should be first con-
verted to normalized volume fractions and then to cumulative
volume fraction (x cv ). For refractive index the characteriza-
tion parameter is I 20 instead of n 20 . Therefore, in Eq. (4.56) we
use parameter I (defined by Eq. 2.36) for property P. Values
of I versus x cv are also given in Table 4.16. Upon regression of
data through Eq. (4.58), we get: I o = 0.218, A I = 0.1189, and
B I = 3.0. For these coefficients the RMS is 0.001 and %AAD
is 0.14%. Value of I o for this sample is close to the lower I
value of C 6 group and parameter B is same as that of spe-
cific gravity. A graphical evaluation of predicted distribution
is shown in Fig. 4.22. Since B = 3, Eq. (4.76) should be used
to calculate I av and then from Eq. (4.81) I av is calculated as
∗
I av = 0.2844. From Eq. (2.114), the mixture refractive index
is calculated as n av = 1.481, which differs from experimental
value of 1.483 by –0.15%.
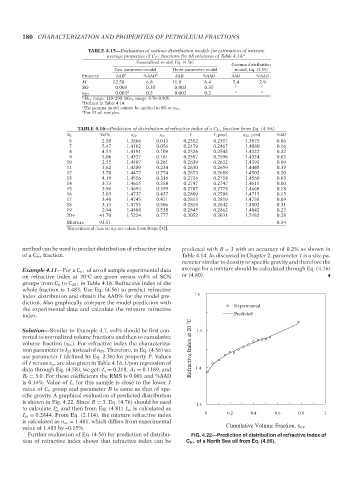
Further evaluation of Eq. (4.56) for prediction of distribu- FIG. 4.22—Prediction of distribution of refractive index of
tion of refractive index shows that refractive index can be C 6+ of a North Sea oil from Eq. (4.56).
--`,```,`,``````,`,````,```,,-`-`,,`,,`,`,,`---
Copyright ASTM International
Provided by IHS Markit under license with ASTM Licensee=International Dealers Demo/2222333001, User=Anggiansah, Erick
No reproduction or networking permitted without license from IHS Not for Resale, 08/26/2021 21:56:35 MDT