
Page 199 - Characterization and Properties of Petroleum Fractions - M.R. Riazi
P. 199
P2: KVU/KXT
QC: —/—
P1: KVU/KXT
T1: IML
June 22, 2007
AT029-Manual
AT029-04
AT029-Manual-v7.cls
21:30
4. CHARACTERIZATION OF RESERVOIR FLUIDS AND CRUDE OILS 179
1.2
Further evaluation of Eq. (4.56) and gamma distribution
model for 45 black oil and 23 gas condensate systems is re-
Experimental
ported in Ref. [25]. Equation (4.56) can be used as either a
Generalized Model
1.1 two- or a three-parameter model. Summary of evaluations is
Constant K w given in Tables 4.14 and 4.15. As mentioned earlier Eq. (4.56)
Specific Gravity, SG 1.0 molar distribution of gas condensate systems and light oils.
Exponential
is more or less equivalent to the gamma distribution model for
Molecular weight range for samples evaluated in Table 4.14 is
from 120 to 290 and for this reason both models give similar
errors for prediction of M distribution (1.2%). However, two-
0.9
parameter form of Eq. (4.56) is equivalent to the exponential
model (B = 1) and gives higher error of 2.2%. For these sys-
tems, the exponential model does not give high errors since
0.8 the systems are not quite heavy. For heavy oils exponential
model is not applicable for prediction of molar distribution.
For T b distribution both three-parameter form of Eq. (4.56)
0.7 and the gamma model are equivalent with error of about 0.6%
0 0.2 0.4 0.6 0.8 1 (=6 K), while the latter gives slightly higher error. The two-
∼
parameter generalized model (B = 1.5 in Eq. 4.56) gives an
Cumulative Volume Fraction, x cv average error of 0.7% for prediction of T b distribution. For
SG distribution through Eq. (4.56), the best value of B is 3
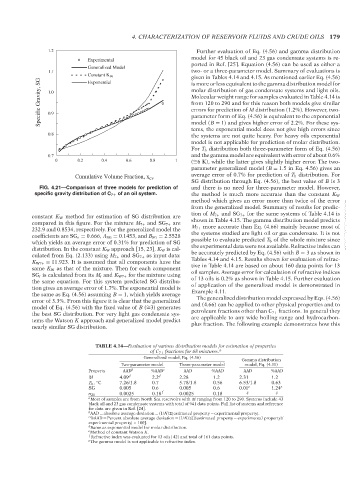
FIG. 4.21—Comparison of three models for prediction of and there is no need for three-parameter model. However,
specific gravity distribution of C 7+ of an oil system. the method is much more accurate than the constant K W
method which gives an error more than twice of the error
from the generalized model. Summary of results for predic-
tion of M 7+ and SG 7+ for the same systems of Table 4.14 is
constant K W method for estimation of SG distribution are
compared in this figure. For the mixture M 7+ and SG 7+ are shown in Table 4.15. The gamma distribution model predicts --`,```,`,``````,`,````,```,,-`-`,,`,,`,`,,`---
232.9 and 0.8534, respectively. For the generalized model the M 7+ more accurate than Eq. (4.66) mainly because most of
coefficients are SG o = 0.666, A SG = 0.1453, and B SG = 2.5528 the systems studied are light oil or gas condensate. It is not
which yields an average error of 0.31% for prediction of SG possible to evaluate predicted T b of the whole mixture since
distribution. In the constant K W approach [15, 23], K W is cal- the experimental data were not available. Refractive index can
culated from Eq. (2.133) using M 7+ and SG 7+ as input data: be accurately predicted by Eq. (4.56) with B = 3 as shown in
K W7+ = 11.923. It is assumed that all components have the Tables 4.14 and 4.15. Results shown for evaluation of refrac-
same K W as that of the mixture. Then for each component tive in Table 4.14 are based on about 160 data points for 13
SG i is calculated from its M i and K W7+ for the mixture using oil samples. Average error for calculation of refractive indices
the same equation. For this system predicted SG distribu- of 13 oils is 0.2% as shown in Table 4.15. Further evaluation
tion gives an average error of 1.7%. The exponential model is of application of the generalized model is demonstrated in
the same as Eq. (4.56) assuming B = 1, which yields average Example 4.11.
error of 3.3%. From this figure it is clear that the generalized The generalized distribution model expressed by Eqs. (4.56)
model of Eq. (4.56) with the fixed value of B (=3) generates and (4.66) can be applied to other physical properties and to
∼
the best SG distribution. For very light gas condensate sys- petroleum fractions other than C 7+ fractions. In general they
tems the Watson K approach and generalized model predict are applicable to any wide boiling range and hydrocarbon-
nearly similar SG distribution. plus fraction. The following example demonstrates how this
TABLE 4.14—Evaluation of various distribution models for estimation of properties
of C 7+ fractions for 68 mixtures. a
Generalized model, Eq. (4.56)
Gamma distribution
Two-parameter model Three-parameter model model, Eq. (4.31)
Property AAD b %AAD c AAD %AAD AAD %AAD
M 4.09 d 2.2 d 2.28 1.2 2.31 1.2
T b , C 7.26/1.8 0.7 5.78/1.8 0.56 6.53/1.8 0.63
◦
SG 0.005 0.6 0.005 0.6 0.01 e 1.24 e
n 20 0.0025 0.18 f 0.0025 0.18 g g
a Most of samples are from North Sea reservoirs with M ranging from 120 to 290. Systems include 43
black oil and 23 gas condensate systems with total of 941 data points. Full list of systems and reference
for data are given in Ref. [24].
b AAD = absolute average deviation = (1/N) |estimated property − experimental property|.
c %AAD = Percent absolute average deviation = (1/N) [|(estimated property − experimental property)/
experimental property|× 100].
d Same as exponential model for molar distribution.
e Method of constant Watson K.
f Refractive index was evaluated for 13 oils [42] and total of 161 data points.
g The gamma model is not applicable to refractive index.
Copyright ASTM International
Provided by IHS Markit under license with ASTM Licensee=International Dealers Demo/2222333001, User=Anggiansah, Erick
No reproduction or networking permitted without license from IHS Not for Resale, 08/26/2021 21:56:35 MDT