
Page 213 - Characterization and Properties of Petroleum Fractions - M.R. Riazi
P. 213
QC: —/—
P2: KVU/KXT
P1: KVU/KXT
T1: IML
8:7
June 23, 2007
AT029-Manual-v7.cls
AT029-Manual
AT029-04
4. CHARACTERIZATION OF RESERVOIR FLUIDS AND CRUDE OILS 193
eters and basic properties of SCN groups from C 6 to C 50 are
erties may be taken from Tables 2.1 and 2.2. Once a crude
given in Table 4.6 and in the form of Eq. (4.7) for computer compounds, the basic characterization parameters and prop-
applications. is expressed in term of a number of components with known
Characterization of C 7+ fraction is presented through appli- properties, a mixture property can be determined through ap-
cation of a distribution model and its parameters may be de- plication of an appropriate mixing rule for the property as it
termined from bulk properties with minimum required data will be shown in the next chapter.
on M 7+ and SG 7+ . Three types of distribution models have
been presented in this chapter: exponential, gamma, and a
generalized model. The exponential model can be used only to 4.10 PROBLEMS
molecular weight and is suitable for light reservoir fluids such
as gas condensate systems and wet natural gases. The gamma 4.1. Consider the dry natural gas, wet natural gas, and gas
distribution model can be applied to both molecular weight condensate systems in Table 1.2. For each reservoir fluid
and boiling point of gas condensate systems. However, the estimate the following properties:
model does not accurately predict molar distribution of very a. SG g and the API gravity.
heavy oils and residues. This model also cannot be applied b. Estimate T pc and P pc from methods of Section 4.2.
to other properties such as specific gravity or refractive in- c. Estimate T pc , P pc , and V pc from Eq. (3.44) using pure
dex. The third model is the most versatile distribution model components properties from Table 2.1 and C 7+ prop-
that can be applied to all major characterization parameters erties from Eqs. (4.12) and (4.13).
of M, T b , SG, and refractive index parameter I. Furthermore, d. Compare the calculated values for T pc and P pc in parts
the generalized distribution model predicts molar distribu- b and c and comment on the results.
tion of heavy oils and residues with reasonable accuracy. Ap- 4.2. Calculate T b , SG, d 20 , n 20 , T c , P c , V c , σ, and δ for C 55 ,C 65 ,
plication of the generalized distribution model (Eq. 4.56) to and C 75 SCN groups.
phase behavior prediction of complex petroleum fluids has 4.3. Predict SCN distribution for the West Texas oil sample
been reported in the literature [46]. Both the gamma and the in Table 4.1, using Eq. (4.27) and M 7+ and x 7+ (mole
generalized distribution models can be reduced to exponen- fraction of C 7+ ) as the available data.
tial in the form of a two-parameter model. 4.4. Derive an analytical expression for Eq. (4.78), and show
Once a distribution model is known for a C 7+ fraction, the that when SG is presented in terms of x cw we have
mixture can be considered as a continuous mixture or it could
be split into a number of pseudocomponents. Examples for 1−k
∞
both cases are presented in this chapter. The method of con- 1 ≡ J = (−1) k+1 B B 1 + k − 1
tinuous distribution approach has been applied to flash dis- SG + 1 k=0 A B
∗
av
tillation of a crude oil and the method of pseudocomponent
approach has been applied to predict sulfur content of an oil. 4.5. Basic characterization data, including M, T b , and SG,
Several characterization schemes have been outlined for dif- versus weight fraction for seven subfractions of a C 7+
ferent cases when different types of data are available. Meth- fluid are given in Table 4.28. Available experimental bulk
ods of splitting and grouping have been presented to represent properties are M 7+ = 142.79, and SG 7+ = 0.7717 [47].
a crude by a number of representative pseudocomponents. Make the following calculations:
A good characterization of a crude oil or a reservoir fluid is a. Calculate x m and x v .
possible when TBP distillation curve is available in addition b. Estimate distribution parameter I from T b and SG
to M 7+ and SG 7+ . The most complete and best characteriza- using methods of Chapter 2.
tion data on a crude oil or a C 7+ fraction would be TBP and SG c. Using experimental data on M, T b , SG and I distribu-
distribution in terms of cumulative weight or volume fraction tions calculate distribution coefficients P o , A and B in
such as those shown in Table 4.27. Knowledge of carbon num- Eq. (4.56) for these properties. Present M in terms of
x cm and T b ,SGand I in terms of x cw .
ber distribution up to C 40 and specification of residue as C 40+
fraction is quite useful and would result in accurate property d. Calculate PDF from Eq. (4.66) and show graphical
prediction provided the amount of the residue (hydrocarbon presentation of F(M), F(T), F(SG), and F(I).
plus) is not more than a few percent. For heavy oils separation e. Find refractive index distribution
up to C 60+ or C 80+ may be needed. When the boiling point of f. Calculate mixture M, T b , SG, and n 20 based on the
the residue in a crude or a C 7+ fraction is not known, a method coefficients obtained in part c.
is proposed to predict this boiling point from the generalized g. For parts b and f calculate errors for M, T b , and SG in
distribution model. When data on characterization of a crude terms of AAD.
are available in terms of distribution of carbon number such
as those shown in Table 4.2, the method of grouping should be
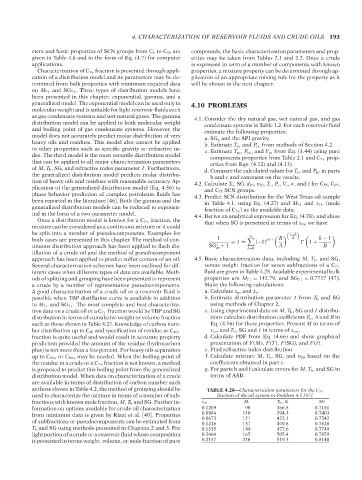
TABLE 4.28—Characterization parameters for the C 7+
used to characterize the mixture in terms of a number of sub- fraction of the oil system in Problem 4.5 [47].
fractions with known mole fraction, M, T b and SG. Further in- x wi M i T bi ,K SG
formation on options available for crude oil characterization 0.1269 98 366.5 0.7181
from minimum data is given by Riazi et al. [40]. Properties 0.0884 110 394.3 0.7403
of subfractions or pseudocomponents can be estimated from 0.0673 121 422.1 0.7542
449.8
131
0.7628
0.1216
T b and SG using methods presented in Chapters 2 and 3. For 0.1335 144 477.6 0.7749
light portion of a crude or a reservoir fluid whose composition 0.2466 165 505.4 0.7859
is presented in terms weight, volume, or mole fraction of pure 0.2157 216 519.3 0.8140
--`,```,`,``````,`,````,```,,-`-`,,`,,`,`,,`---
Copyright ASTM International
Provided by IHS Markit under license with ASTM Licensee=International Dealers Demo/2222333001, User=Anggiansah, Erick
No reproduction or networking permitted without license from IHS Not for Resale, 08/26/2021 21:56:35 MDT