
Page 221 - Characterization and Properties of Petroleum Fractions - M.R. Riazi
P. 221
QC: IML/FFX
T1: IML
P2: IML/FFX
P1: IML/FFX
AT029-Manual-v7.cls
AT029-Manual
17:42
AT029-05
August 16, 2007
triple point, which is a point on the PT diagram, becomes a
line on the PV diagram. For a mixture, as shown in Fig. 5.2b, 5. PVT RELATIONS AND EQUATIONS OF STATE 201
the two-phase region is under the envelope and bubble point
and dew points curves meet each other at the critical point.
The main application of PT diagram is to determine the phase
of a system under certain conditions of temperature and pres-
sure as will be discussed in Chapter 9 (Section 9.2.3). Figure
5.1 shows that as temperature of a pure substance increases,
at constant pressure, the following phase changes occur:
Subcooled solid (1) → Saturated solid at sublimation
temperature (2) → Saturated liquid at sublimation
temperature (3) → Subcooled liquid (4) → Saturated
liquid at vaporization temperature (5) → Saturated
vapor at vaporization temperature (6)→ Superheated
vapor (7)
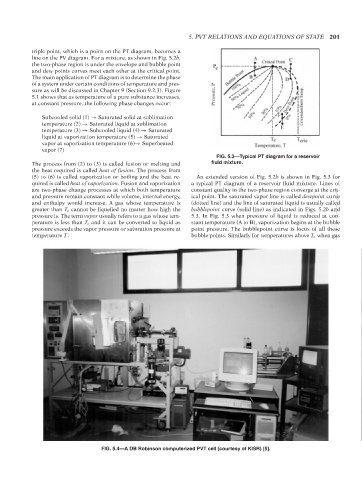
FIG. 5.3—Typical PT diagram for a reservoir
The process from (2) to (3) is called fusion or melting and fluid mixture.
the heat required is called heat of fusion. The process from
(5) to (6) is called vaporization or boiling and the heat re- An extended version of Fig. 5.2b is shown in Fig. 5.3 for
quired is called heat of vaporization. Fusion and vaporization a typical PT diagram of a reservoir fluid mixture. Lines of
are two-phase change processes at which both temperature constant quality in the two-phase region converge at the crit-
and pressure remain constant while volume, internal energy, ical point. The saturated vapor line is called dewpoint curve
and enthalpy would increase. A gas whose temperature is (dotted line) and the line of saturated liquid is usually called
greater than T c cannot be liquefied no matter how high the bubblepoint curve (solid line) as indicated in Figs. 5.2b and
pressure is. The term vapor usually refers to a gas whose tem- 5.3. In Fig. 5.3 when pressure of liquid is reduced at con- --`,```,`,``````,`,````,```,,-`-`,,`,,`,`,,`---
perature is less than T c and it can be converted to liquid as stant temperature (A to B), vaporization begins at the bubble
pressure exceeds the vapor pressure or saturation pressure at point pressure. The bubblepoint curve is locus of all these
temperature T. bubble points. Similarly for temperatures above T c when gas
FIG. 5.4—A DB Robinson computerized PVT cell (courtesy of KISR) [5].
Copyright ASTM International
Provided by IHS Markit under license with ASTM Licensee=International Dealers Demo/2222333001, User=Anggiansah, Erick
No reproduction or networking permitted without license from IHS Not for Resale, 08/26/2021 21:56:35 MDT