
Page 220 - Characterization and Properties of Petroleum Fractions - M.R. Riazi
P. 220
P2: IML/FFX
T1: IML
P1: IML/FFX
QC: IML/FFX
AT029-Manual
17:42
August 16, 2007
AT029-05
AT029-Manual-v7.cls
200 CHARACTERIZATION AND PROPERTIES OF PETROLEUM FRACTIONS
C Gas
Fusion
Gas Curve
Liquid Liquid Region
C
Solid Region
Solid/Liquid Vaporization
P Saturated T 3 > T C P
Liquid
Solid 0% Liquid / vapor 90% T 2 = T C 1 atm Curve
10%
30% 70% Vapor
50% Vapor 100% T 1 < T C Triple Point
Triple Line
Saturated Vapor
Vapor
Solid / vapor
V C
V
T f T b T c
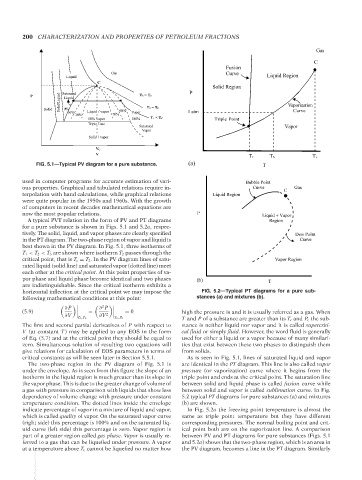
FIG. 5.1—Typical PV diagram for a pure substance. (a) T
used in computer programs for accurate estimation of vari- Bubble Point
ous properties. Graphical and tabulated relations require in- Curve C Gas
terpolation with hand calculations, while graphical relations Liquid Region
were quite popular in the 1950s and 1960s. With the growth
of computers in recent decades mathematical equations are
now the most popular relations. P Liquid + Vapor
A typical PVT relation in the form of PV and PT diagrams Region
for a pure substance is shown in Figs. 5.1 and 5.2a, respec-
tively. The solid, liquid, and vapor phases are clearly specified Dew Point
in the PT diagram. The two-phase region of vapor and liquid is Curve
best shown in the PV diagram. In Fig. 5.1, three isotherms of
T 1 < T 2 < T 3 are shown where isotherm T 2 passes through the
critical point, that is T c = T 2 . In the PV diagram lines of satu- Vapor Region
rated liquid (solid line) and saturated vapor (dotted line) meet
each other at the critical point. At this point properties of va-
por phase and liquid phase become identical and two phases (b) T
are indistinguishable. Since the critical isotherm exhibits a
horizontal inflection at the critical point we may impose the FIG. 5.2—Typical PT diagrams for a pure sub-
following mathematical conditions at this point: stances (a) and mixtures (b).
2
(5.9) ∂ P = ∂ P = 0 high the pressure is and it is usually referred as a gas. When
∂V ∂V 2
T c ,P c T c ,P c T and P of a substance are greater than its T c and P c the sub-
The first and second partial derivatives of P with respect to stance is neither liquid nor vapor and it is called supercriti-
V (at constant T) may be applied to any EOS in the form cal fluid or simply fluid. However, the word fluid is generally
of Eq. (5.7) and at the critical point they should be equal to used for either a liquid or a vapor because of many similari-
zero. Simultaneous solution of resulting two equations will ties that exist between these two phases to distinguish them
give relations for calculation of EOS parameters in terms of from solids.
critical constants as will be seen later in Section 5.5.1. As is seen in Fig. 5.1, lines of saturated liquid and vapor
The two-phase region in the PV diagram of Fig. 5.1 is are identical in the PT diagram. This line is also called vapor
under the envelope. As is seen from this figure the slope of an pressure (or vaporization) curve where it begins from the
isotherm in the liquid region is much greater than its slope in triple point and ends at the critical point. The saturation line
the vapor phase. This is due to the greater change of volume of between solid and liquid phase is called fusion curve while
a gas with pressure in comparison with liquids that show less between solid and vapor is called sublimation curve. In Fig.
dependency of volume change with pressure under constant 5.2 typical PT diagrams for pure substances (a) and mixtures
temperature condition. The dotted lines inside the envelope (b) are shown.
indicate percentage of vapor in a mixture of liquid and vapor, In Fig. 5.2a the freezing point temperature is almost the
which is called quality of vapor. On the saturated vapor curve same as triple point temperature but they have different
(right side) this percentage is 100% and on the saturated liq- corresponding pressures. The normal boiling point and crit-
uid curve (left side) this percentage is zero. Vapor region is ical point both are on the vaporization line. A comparison
part of a greater region called gas phase. Vapor is usually re- between PV and PT diagrams for pure substances (Figs. 5.1
ferred to a gas that can be liquefied under pressure. A vapor and 5.2a) shows that the two-phase region, which is an area in
at a temperature above T c cannot be liquefied no matter how the PV diagram, becomes a line in the PT diagram. Similarly
--`,```,`,``````,`,````,```,,-`-`,,`,,`,`,,`---
Copyright ASTM International
Provided by IHS Markit under license with ASTM Licensee=International Dealers Demo/2222333001, User=Anggiansah, Erick
No reproduction or networking permitted without license from IHS Not for Resale, 08/26/2021 21:56:35 MDT