
Page 411 - Characterization and Properties of Petroleum Fractions - M.R. Riazi
P. 411
T1: IML
P2: IML/FFX
QC: IML/FFX
P1: IML/FFX
AT029-Manual-v7.cls
AT029-09
June 22, 2007
14:25
AT029-Manual
9. APPLICATIONS: PHASE EQUILIBRIUM CALCULATIONS 391
1.0
0.9
M y
0.8 N 1
0.7
0.6 M y F v
Fraction 0.5 C 1
0.4 S g
0.3
M
0.2 C 1 x
FIG. 9.25—Idealized fractured F y
reservoirs (after Warren and 0.1 C 1
Root [57]). 0.0
0 10 20 30 40 50 60 70 80 90 100
components in the oil diffuse in the opposite direction from Time, h
matrix to the fracture. This process continues until the gas
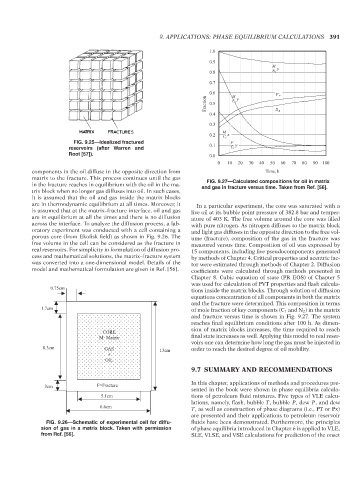
FIG. 9.27—Calculated compositions for oil in matrix
in the fracture reaches in equilibrium with the oil in the ma- and gas in fracture versus time. Taken from Ref. [56].
trix block when no longer gas diffuses into oil. In such cases,
it is assumed that the oil and gas inside the matrix blocks
are in thermodynamic equilibrium at all times. Moreover, it In a particular experiment, the core was saturated with a
is assumed that at the matrix–fracture interface, oil and gas live oil at its bubble point pressure of 382.8 bar and temper-
are in equilibrium at all the times and there is no diffusion ature of 403 K. The free volume around the core was filled
across the interface. To analyze the diffusion process, a lab- with pure nitrogen. As nitrogen diffuses to the matrix block
oratory experiment was conducted with a cell containing a and light gas diffuses in the opposite direction to the free vol-
porous core (from Ekofisk field) as shown in Fig. 9.26. The ume (fracture), composition of the gas in the fracture was
free volume in the cell can be considered as the fracture in measured versus time. Composition of oil was expressed by
real reservoirs. For simplicity in formulation of diffusion pro- 15 components, including five pseudocomponents generated
cess and mathematical solutions, the matrix–fracture system by methods of Chapter 4. Critical properties and acentric fac-
was converted into a one-dimensional model. Details of the tor were estimated through methods of Chapter 2. Diffusion
model and mathematical formulation are given in Ref. [56]. coefficients were calculated through methods presented in
Chapter 8. Cubic equation of state (PR EOS) of Chapter 5
was used for calculation of PVT properties and flash calcula-
0.75cm
tions inside the matrix blocks. Through solution of diffusion
equations concentration of all components in both the matrix
and the fracture were determined. This composition in terms
1.7cm of mole fraction of key components (C 1 and N 2 ) in the matrix
and fracture versus time is shown in Fig. 9.27. The system
reaches final equilibrium conditions after 100 h. As dimen-
sion of matrix blocks increases, the time required to reach
CORE
M=Matrix final state increases as well. Applying this model to real reser-
voirs one can determine how long the gas must be injected in
8.3cm GAS 13cm order to reach the desired degree of oil mobility.
+
OIL
9.7 SUMMARY AND RECOMMENDATIONS
In this chapter, applications of methods and procedures pre-
3cm F=Fracture
sented in the book were shown in phase equilibria calcula-
5.1cm tions of petroleum fluid mixtures. Five types of VLE calcu-
lations, namely, flash, bubble T, bubble P, dew P, and dew
6.6cm
T, as well as construction of phase diagrams (i.e., PT or Px)
are presented and their applications to petroleum reservoir
FIG. 9.26—Schematic of experimental cell for diffu- fluids have been demonstrated. Furthermore, the principles
sion of gas in a matrix block. Taken with permission of phase equilibria introduced in Chapter 6 is applied to VLE,
from Ref. [56]. SLE, VLSE, and VSE calculations for prediction of the onset
--`,```,`,``````,`,````,```,,-`-`,,`,,`,`,,`---
Copyright ASTM International
Provided by IHS Markit under license with ASTM Licensee=International Dealers Demo/2222333001, User=Anggiansah, Erick
No reproduction or networking permitted without license from IHS Not for Resale, 08/26/2021 21:56:35 MDT