
Page 413 - Characterization and Properties of Petroleum Fractions - M.R. Riazi
P. 413
T1: IML
QC: IML/FFX
P2: IML/FFX
P1: IML/FFX
AT029-Manual-v7.cls
14:25
AT029-09
June 22, 2007
AT029-Manual
9. APPLICATIONS: PHASE EQUILIBRIUM CALCULATIONS 393
measurement and reporting of such data should be contin-
volume cell.
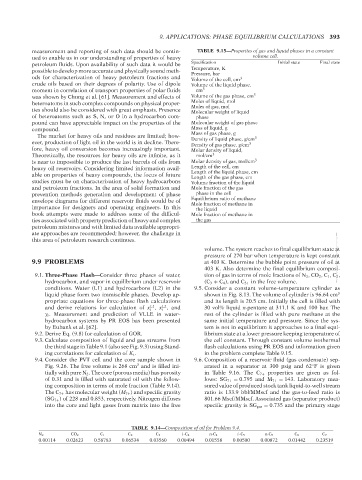
ued to enable us in our understanding of properties of heavy TABLE 9.15—Properties of gas and liquid phases in a constant
petroleum fluids. Upon availability of such data it would be Specification Initial state Final state
possible to develop more accurate and physically sound meth- Temperature, K
Pressure, bar
ods for characterization of heavy petroleum fractions and Volume of the cell, cm 3
crude oils based on their degrees of polarity. Use of dipole Volume of the liquid phase,
moment in correlation of transport properties of polar fluids cm 3
was shown by Chung et al. [61]. Measurement and effects of Volume of the gas phase, cm 3
heteroatoms in such complex compounds on physical proper- Moles of liquid, mol
ties should also be considered with great emphasis. Presence Moles of gas, mol
Molecular weight of liquid
of heteroatoms such as S, N, or O in a hydrocarbon com- phase
pound can have appreciable impact on the properties of the Molecular weight of gas phase
compound. Mass of liquid, g
The market for heavy oils and residues are limited; how- Mass of gas phase, g 3
Density of liquid phase, g/cm
ever, production of light oil in the world is in decline. There- Density of gas phase, g/cm 3
fore, heavy oil conversion becomes increasingly important. Molar density of liquid,
Theoretically, the resources for heavy oils are infinite, as it mol/cm 3
is near to impossible to produce the last barrels of oils from Molar density of gas, mol/cm 3
heavy oil reservoirs. Considering limited information avail- Length of the cell, cm
able on properties of heavy compounds, the focus of future Length of the liquid phase, cm
Length of the gas phase, cm
studies must be on characterization of heavy hydrocarbons Volume fraction of the liquid
and petroleum fractions. In the area of solid formation and Mole fraction of the gas
prevention methods generation and development of phase phase in the cell
envelope diagrams for different reservoir fluids would be of Equilibrium ratio of methane
importance for designers and operating engineers. In this Mole fraction of methane in
the liquid
book attempts were made to address some of the difficul- Mole fraction of methane in
ties associated with property prediction of heavy and complex the gas
petroleum mixtures and with limited data available appropri-
ate approaches are recommended; however, the challenge in
--`,```,`,``````,`,````,```,,-`-`,,`,,`,`,,`---
this area of petroleum research continues.
volume. The system reaches to final equilibrium state at
pressure of 270 bar when temperature is kept constant
9.9 PROBLEMS at 403 K. Determine the bubble point pressure of oil at
403 K. Also determine the final equilibrium composi-
9.1. Three-Phase Flash—Consider three phases of water, tion of gas in terms of mole fractions of N 2 ,CO 2 ,C 1 ,C 2 ,
hydrocarbon, and vapor in equilibrium under reservoir (C 3 + C 4 ), and C 5+ in the free volume.
conditions. Water (L1) and hydrocarbons (L2) in the 9.5. Consider a constant volume–temperature cylinder as
liquid phase form two immiscible phases. Develop ap- shown in Fig. 8.13. The volume of cylinder is 96.64 cm 3
propriate equations for three-phase flash calculations and its length is 20.5 cm. Initially the cell is filled with
L2
and derive relations for calculation of x , x , and 30 vol% liquid n-pentane at 311.1 K and 100 bar. The
L1
i
i
y i . Measurement and prediction of VLLE in water– rest of the cylinder is filled with pure methane at the
hydrocarbon systems by PR EOS has been presented same initial temperature and pressure. Since the sys-
by Eubank et al. [62]. tem is not in equilibrium it approaches to a final equi-
9.2. Derive Eq. (9.8) for calculation of GOR. librium state at a lower pressure keeping temperature of
9.3. Calculate composition of liquid and gas streams from the cell constant. Through constant volume isothermal
the third stage in Table 9.1 (also see Fig. 9.3) using Stand- flash calculations using PR EOS and information given
ing correlations for calculation of K i . in the problem complete Table 9.15.
9.4. Consider the PVT cell and the core sample shown in 9.6. Composition of a reservoir fluid (gas condensate) sep-
3
Fig. 9.26. The free volume is 268 cm and is filled ini- arated in a separator at 300 psig and 62 F is given
◦
tially with pure N 2 . The core (porous media) has porosity in Table 9.16. The C 7+ properties are given as fol-
of 0.31 and is filled with saturated oil with the follow- lows: SG 7+ = 0.795 and M 7+ = 143. Laboratory mea-
ing composition in terms of mole fraction (Table 9.14). sured value of produced stock tank liquid-to-well stream
The C 7+ has molecular weight (M 7+ ) and specific gravity ratio is 133.9 bbl/MMscf and the gas-to-feed ratio is
(SG 7+ ) of 228 and 0.853, respectively. Nitrogen diffuses 801.66 Mscf/MMscf. Associated gas (separator product)
into the core and light gases from matrix into the free specific gravity is SG gas = 0.735 and the primary stage
TABLE 9.14—Composition of oil for Problem 9.4.
N 2 CO 2 C 1 C 2 C 3 i-C 4 n-C 4 i-C 5 n-C 5 C 6 C 7
0.00114 0.02623 0.58783 0.06534 0.03560 0.00494 0.01558 0.00500 0.00872 0.01442 0.23519
Copyright ASTM International
Provided by IHS Markit under license with ASTM Licensee=International Dealers Demo/2222333001, User=Anggiansah, Erick
No reproduction or networking permitted without license from IHS Not for Resale, 08/26/2021 21:56:35 MDT