
Page 94 - Characterization and Properties of Petroleum Fractions - M.R. Riazi
P. 94
QC: —/—
T1: IML
P2: —/—
P1: KVU/—
AT029-Manual-v7.cls
AT029-Manual
AT029-02
74 CHARACTERIZATION AND PROPERTIES OF PETROLEUM FRACTIONS
Specific Gravity, 60 F/60 F August 16, 2007 16:6 F
API Gravity Aniline Point, Mean Average Boiling Point, F
Ratio Watson Characterization Factor, K Molecular Weight
Carbon-to-Hydrogen Weight
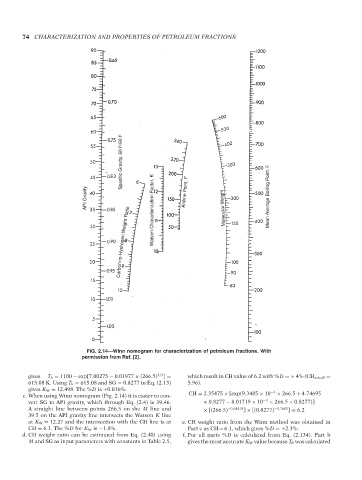
FIG. 2.14—Winn nomogram for characterization of petroleum fractions. With
permission from Ref. [2].
gives T b = 1100 − exp[7.00275 − 0.01977 × (266.5) 2/3 ] = which result in CH value of 6.2 with %D =+ 4% (CH actual =
615.08 K. Using T b = 615.08 and SG = 0.8277 in Eq. (2.13) 5.96).
gives K W = 12.498. The %D is +0.016%. −3
c. When using Winn nomogram (Fig. 2.14) it is easier to con- CH = 2.35475 × [exp(9.3485 × 10 × 266.5 + 4.74695
vert SG to API gravity, which through Eq. (2.4) is 39.46. × 0.8277 − 8.01719 × 10 −3 × 266.5 × 0.8277)]
A straight line between points 266.5 on the M line and × [(266.5) −0.68418 ] × [(0.8277) −0.7682 ] = 6.2
39.5 on the API gravity line intersects the Watson K line
at K W = 12.27 and the intersection with the CH line is at e. CH weight ratio from the Winn method was obtained in
CH = 6.1. The %D for K W is −1.8%. PartcasCH = 6.1, which gives %D =+2.3%.
d. CH weight ratio can be estimated from Eq. (2.40) using f. For all parts %D is calculated from Eq. (2.134). Part b
M and SG as input parameters with constants in Table 2.5, gives the most accurate K W value because T b was calculated
--`,```,`,``````,`,````,```,,-`-`,,`,,`,`,,`---
Copyright ASTM International
Provided by IHS Markit under license with ASTM Licensee=International Dealers Demo/2222333001, User=Anggiansah, Erick
No reproduction or networking permitted without license from IHS Not for Resale, 08/26/2021 21:56:35 MDT