
Page 97 - Characterization and Properties of Petroleum Fractions - M.R. Riazi
P. 97
QC: —/—
P2: —/—
P1: KVU/—
AT029-Manual
AT029-Manual-v7.cls
AT029-02
2. CHARACTERIZATION AND PROPERTIES OF PURE HYDROCARBONS 77
Molecular Weight T1: IML August 16, 2007 16:6
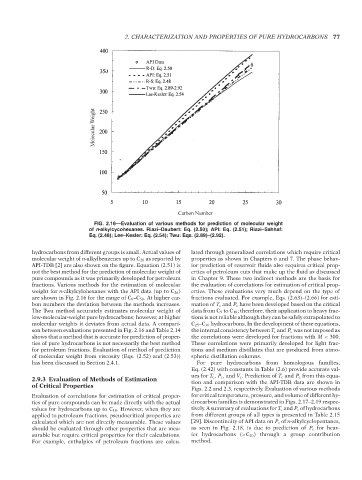
FIG. 2.16—Evaluation of various methods for prediction of molecular weight
of n-alkylcycohexanes. Riazi–Daubert: Eq. (2.50); API: Eq. (2.51); Riazi–Sahhaf:
Eq. (2.48); Lee–Kesler: Eq. (2.54); Twu: Eqs. (2.89)–(2.92).
hydrocarbons from different groups is small. Actual values of lated through generalized correlations which require critical
molecular weight of n-alkylbenzenes up to C 20 as reported by properties as shown in Chapters 6 and 7. The phase behav-
API-TDB [2] are also shown on the figure. Equation (2.51) is ior prediction of reservoir fluids also requires critical prop-
not the best method for the prediction of molecular weight of erties of petroleum cuts that make up the fluid as discussed
pure compounds as it was primarily developed for petroleum in Chapter 9. These two indirect methods are the basis for
fractions. Various methods for the estimation of molecular the evaluation of correlations for estimation of critical prop-
weight for n-alkylcylohexanes with the API data (up to C 26 ) erties. These evaluations very much depend on the type of
are shown in Fig. 2.16 for the range of C 6 –C 50 . At higher car- fractions evaluated. For example, Eqs. (2.63)–(2.66) for esti-
bon numbers the deviation between the methods increases. mation of T c and P c have been developed based on the critical
The Twu method accurately estimates molecular weight of data from C 5 to C 18 ; therefore, their application to heavy frac-
low-molecular-weight pure hydrocarbons; however, at higher tions is not reliable although they can be safely extrapolated to
molecular weights it deviates from actual data. A compari- C 25 –C 30 hydrocarbons. In the development of these equations,
son between evaluations presented in Fig. 2.16 and Table 2.14 the internal consistency between T c and P c was not imposed as
shows that a method that is accurate for prediction of proper- the correlations were developed for fractions with M < 300.
ties of pure hydrocarbons is not necessarily the best method These correlations were primarily developed for light frac-
for petroleum fractions. Evaluation of method of prediction tions and medium distillates that are produced from atmo-
of molecular weight from viscosity (Eqs. (2.52) and (2.53)) spheric distillation columns.
has been discussed in Section 2.4.1. For pure hydrocarbons from homologous families,
Eq. (2.42) with constants in Table (2.6) provide accurate val-
ues for T c , P c , and V c . Prediction of T c and P c from this equa-
2.9.3 Evaluation of Methods of Estimation tion and comparison with the API-TDB data are shown in
of Critical Properties
Figs. 2.2 and 2.3, respectively. Evaluation of various methods
Evaluation of correlations for estimation of critical proper- for critical temperature, pressure, and volume of different hy-
ties of pure compounds can be made directly with the actual drocarbon families is demonstrated in Figs. 2.17–2.19 respec-
values for hydrocarbons up to C 18 . However, when they are tively. A summary of evaluations for T c and P c of hydrocarbons
applied to petroleum fractions, pseudocritical properties are from different groups of all types is presented in Table 2.15
calculated which are not directly measurable. These values [29]. Discontinuity of API data on P c of n-alkylcyclopentanes,
should be evaluated through other properties that are mea- as seen in Fig. 2.18, is due to prediction of P c for heav-
surable but require critical properties for their calculations. ier hydrocarbons (>C 20 ) through a group contribution
For example, enthalpies of petroleum fractions are calcu- method.
--`,```,`,``````,`,````,```,,-`-`,,`,,`,`,,`---
Copyright ASTM International
Provided by IHS Markit under license with ASTM Licensee=International Dealers Demo/2222333001, User=Anggiansah, Erick
No reproduction or networking permitted without license from IHS Not for Resale, 08/26/2021 21:56:35 MDT