
Page 96 - Characterization and Properties of Petroleum Fractions - M.R. Riazi
P. 96
P2: —/—
T1: IML
QC: —/—
P1: KVU/—
16:6
August 16, 2007
AT029-Manual-v7.cls
AT029-Manual
AT029-02
76 CHARACTERIZATION AND PROPERTIES OF PETROLEUM FRACTIONS
data set. For example, when the method of neural network is
a
weight of petroleum fractions.
used to obtain correlations for estimation of critical proper- TABLE 2.14—Evaluation of methods for estimation of molecular
ties, a very accurate correlation can be obtained for a large Abs Dev % ∗∗
number of compounds [82]. However, such correlations con- Method Equation(s) AAD% MAD%
tain as many as 30 numerical values, which limit their power API (Riazi–Daubert) (2.51) 3.9 18.7
of extrapolatability. It is our experience that when a corre- Twu (2.89)–(2.92) 5.0 16.1
lation is based on some theoretical foundation, it has fewer Kesler–Lee (2.54) 8.2 28.2
5.4
25.9
Winn
(2.93)
constants with a wider range of application and better ex- a Number of data points: 625; Ranges of data: M ∼ 70–700, T b ∼ 300–850, SG
trapolatability. This is particularly evident for the case of ∼ 0.63–0.97
b
Eq. (2.38) developed based on the theory of intermolecular Defined by Eqs. (2.134) and (135). Reference [29].
forces and EOS parameters. Equation (2.38) has only three
parameters that are obtained from data on properties of pure fractions. This equation has been included in most process
hydrocarbons from C 5 to C 20 . This equation for various prop- simulators [54–56]. Whitson [51, 53] has used this equation
erties can be safely used up to C 30 . Tsonopoulos et al. [34]
and its conversion to K W (Eq. 2.133) for fractions up to C 25
and Lin et al. [83] have extensively evaluated Eq. (2.50) for in his characterization methods of reservoir fluids. A more
estimation of the molecular weight of different samples of general form of this equation is given by Eq. (2.51) for the
coal liquids, which are mainly aromatics, and compared with molecular weight range of 70–700. This equation gives an
other sophisticated multiparameter correlations specifically average error of 3.4% for fractions with M < 300 and 4.7%
developed for the molecular weight of coal liquids. Their con- for fractions with M > 300 for 625 fractions from Penn State
clusion was that Eq. (2.50) gave the lowest error even though database on petroleum fractions. An advantage of Eq. (2.51)
only pure component data were used to develop this equation. over Eq. (2.50) is that it is applicable to both light and heavy
Further evaluation of characterization methods for molecu- fractions. A comparative evaluation of various correlations
lar weight and critical properties are given in the following for estimation of molecular weight is given in Table 2.14 [29].
parts. Process simulators [55] usually have referred to Eq. (2.50)
as Riazi–Daubert method and Eq. (2.51) as the API method.
2.9.2 Evaluation of Methods of Estimation The Winn method, Eq. (2.93), has been also referred as Sim–
of Molecular Weight Daubert method in some sources [55, 84].
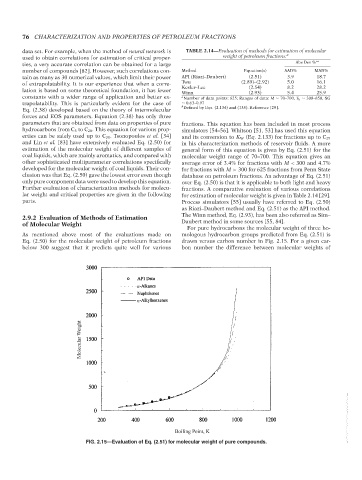
For pure hydrocarbons the molecular weight of three ho-
As mentioned above most of the evaluations made on mologous hydrocarbon groups predicted from Eq. (2.51) is
Eq. (2.50) for the molecular weight of petroleum fractions drawn versus carbon number in Fig. 2.15. For a given car-
below 300 suggest that it predicts quite well for various bon number the difference between molecular weights of
n
n
Molecular Weight
--`,```,`,``````,`,````,```,,-`-`,,`,,`,`,,`---
Boiling Point, K
FIG. 2.15—Evaluation of Eq. (2.51) for molecular weight of pure compounds.
Copyright ASTM International
Provided by IHS Markit under license with ASTM Licensee=International Dealers Demo/2222333001, User=Anggiansah, Erick
No reproduction or networking permitted without license from IHS Not for Resale, 08/26/2021 21:56:35 MDT