
Page 99 - Characterization and Properties of Petroleum Fractions - M.R. Riazi
P. 99
QC: —/—
P2: —/—
P1: KVU/—
AT029-Manual
AT029-Manual-v7.cls
AT029-02
2. CHARACTERIZATION AND PROPERTIES OF PURE HYDROCARBONS 79
Critical Volume cm 3 /mol T1: IML August 16, 2007 16:6
Carbon Number
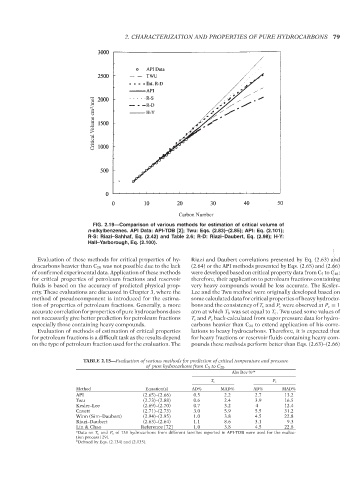
FIG. 2.19—Comparison of various methods for estimation of critical volume of
n-alkylbenzenes. API Data: API-TDB [2]; Twu: Eqs. (2.83)–(2.85); API: Eq. (2.101);
R-S: Riazi–Sahhaf, Eq. (2.42) and Table 2.6; R-D: Riazi–Daubert, Eq. (2.98); H-Y:
Hall–Yarborough, Eq. (2.100).
--`,```,`,``````,`,````,```,,-`-`,,`,,`,`,,`---
Evaluation of these methods for critical properties of hy- Riazi and Daubert correlations presented by Eq. (2.63) and
drocarbons heavier than C 20 was not possible due to the lack (2.64) or the API methods presented by Eqs. (2.65) and (2.66)
of confirmed experimental data. Application of these methods were developed based on critical property data from C 5 to C 18 ;
for critical properties of petroleum fractions and reservoir therefore, their application to petroleum fractions containing
fluids is based on the accuracy of predicted physical prop- very heavy compounds would be less accurate. The Kesler–
erty. These evaluations are discussed in Chapter 3, where the Lee and the Twu method were originally developed based on
method of pseudocomponent is introduced for the estima- some calculated data for critical properties of heavy hydrocar-
tion of properties of petroleum fractions. Generally, a more bons and the consistency of T c and P c were observed at P c = 1
accurate correlation for properties of pure hydrocarbons does atm at which T b was set equal to T c . Twu used some values of
not necessarily give better prediction for petroleum fractions T c and P c back-calculated from vapor pressure data for hydro-
especially those containing heavy compounds. carbons heavier than C 20 to extend application of his corre-
Evaluation of methods of estimation of critical properties lations to heavy hydrocarbons. Therefore, it is expected that
for petroleum fractions is a difficult task as the results depend for heavy fractions or reservoir fluids containing heavy com-
on the type of petroleum fraction used for the evaluation. The pounds these methods perform better than Eqs. (2.63)–(2.66)
TABLE 2.15—Evaluation of various methods for prediction of critical temperature and pressure
of pure hydrocarbons from C 5 to C 20 .
Abs Dev % ∗∗
T c P c
Method Equation(s) AD% MAD% AD% MAD%
API (2.65)–(2.66) 0.5 2.2 2.7 13.2
Twu (2.73)–(2.88) 0.6 2.4 3.9 16.5
Kesler–Lee (2.69)–(2.70) 0.7 3.2 4 12.4
Cavett (2.71)–(2.73) 3.0 5.9 5.5 31.2
Winn (Sim–Daubert) (2.94)–(2.95) 1.0 3.8 4.5 22.8
Riazi–Daubert (2.63)–(2.64) 1.1 8.6 3.1 9.3
Lin & Chao Reference [72] 1.0 3.8 4.5 22.8
a Data on T c and P c of 138 hydrocarbons from different families reported in API-TDB were used for the evalua-
tion process [29].
b Defined by Eqs. (2.134) and (2.135).
Copyright ASTM International
Provided by IHS Markit under license with ASTM Licensee=International Dealers Demo/2222333001, User=Anggiansah, Erick
No reproduction or networking permitted without license from IHS Not for Resale, 08/26/2021 21:56:35 MDT