
Page 125 - Mechanical Behavior of Materials
P. 125
126 Chapter 4 Mechanical Testing: Tension Test and Other Basic Tests
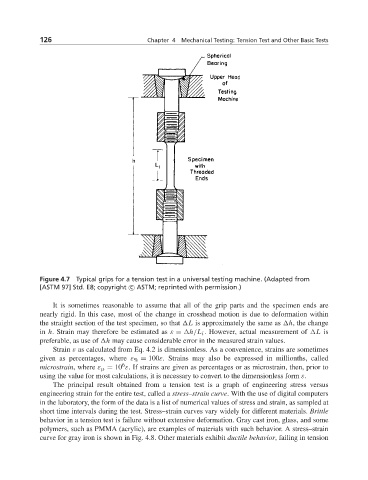
Figure 4.7 Typical grips for a tension test in a universal testing machine. (Adapted from
[ASTM 97] Std. E8; copyright c ASTM; reprinted with permission.)
It is sometimes reasonable to assume that all of the grip parts and the specimen ends are
nearly rigid. In this case, most of the change in crosshead motion is due to deformation within
the straight section of the test specimen, so that L is approximately the same as h, the change
in h. Strain may therefore be estimated as ε = h/L i . However, actual measurement of L is
preferable, as use of h may cause considerable error in the measured strain values.
Strain ε as calculated from Eq. 4.2 is dimensionless. As a convenience, strains are sometimes
given as percentages, where ε % = 100ε. Strains may also be expressed in millionths, called
6
microstrain, where ε μ = 10 ε. If strains are given as percentages or as microstrain, then, prior to
using the value for most calculations, it is necessary to convert to the dimensionless form ε.
The principal result obtained from a tension test is a graph of engineering stress versus
engineering strain for the entire test, called a stress–strain curve. With the use of digital computers
in the laboratory, the form of the data is a list of numerical values of stress and strain, as sampled at
short time intervals during the test. Stress–strain curves vary widely for different materials. Brittle
behavior in a tension test is failure without extensive deformation. Gray cast iron, glass, and some
polymers, such as PMMA (acrylic), are examples of materials with such behavior. A stress–strain
curve for gray iron is shown in Fig. 4.8. Other materials exhibit ductile behavior, failing in tension