
Page 126 - Mechanical Behavior of Materials
P. 126
Section 4.2 Introduction to Tension Test 127
200
Fracture
150
20
σ, Stress, MPa 100 σ, ksi
50 Gray cast iron 10
0 0
0.004 0.008 0.012
ε, Strain
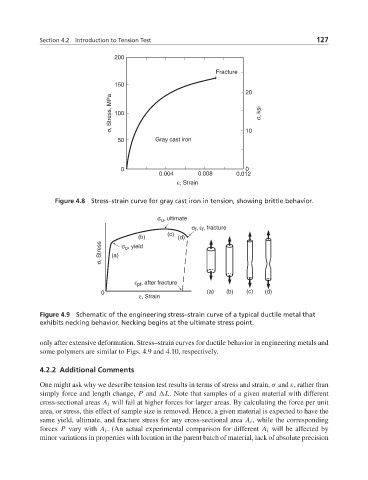
Figure 4.8 Stress–strain curve for gray cast iron in tension, showing brittle behavior.
σ , ultimate
u
σ , ε , fracture
f f
(c)
(b) (d)
σ, Stress (a) σ , yield
o
ε pf , after fracture
0 (a) (b) (c) (d)
ε, Strain
Figure 4.9 Schematic of the engineering stress–strain curve of a typical ductile metal that
exhibits necking behavior. Necking begins at the ultimate stress point.
only after extensive deformation. Stress–strain curves for ductile behavior in engineering metals and
some polymers are similar to Figs. 4.9 and 4.10, respectively.
4.2.2 Additional Comments
One might ask why we describe tension test results in terms of stress and strain, σ and ε, rather than
simply force and length change, P and L. Note that samples of a given material with different
cross-sectional areas A i will fail at higher forces for larger areas. By calculating the force per unit
area, or stress, this effect of sample size is removed. Hence, a given material is expected to have the
same yield, ultimate, and fracture stress for any cross-sectional area A i , while the corresponding
forces P vary with A i . (An actual experimental comparison for different A i will be affected by
minor variations in properties with location in the parent batch of material, lack of absolute precision