
Page 128 - Mechanical Behavior of Materials
P. 128
Section 4.3 Engineering Stress–Strain Properties 129
σ , ε o σ ou
o
σ ol
E t
σ p σ p σ o
σ, Stress B σ o
p
E σ = ?
A
(a) (b) (c)
0 0 0
0.002 = ε po
ε, Strain
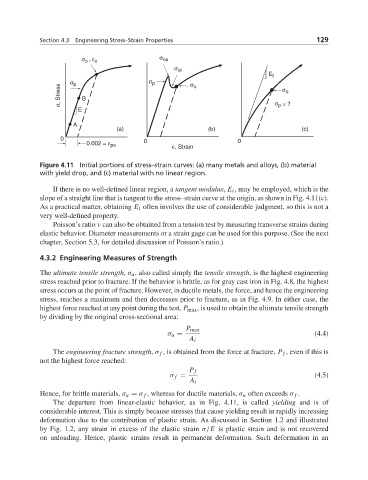
Figure 4.11 Initial portions of stress–strain curves: (a) many metals and alloys, (b) material
with yield drop, and (c) material with no linear region.
If there is no well-defined linear region, a tangent modulus, E t , may be employed, which is the
slope of a straight line that is tangent to the stress–strain curve at the origin, as shown in Fig. 4.11(c).
As a practical matter, obtaining E t often involves the use of considerable judgment, so this is not a
very well-defined property.
Poisson’s ratio ν can also be obtained from a tension test by measuring transverse strains during
elastic behavior. Diameter measurements or a strain gage can be used for this purpose. (See the next
chapter, Section 5.3, for detailed discussion of Poisson’s ratio.)
4.3.2 Engineering Measures of Strength
The ultimate tensile strength, σ u , also called simply the tensile strength, is the highest engineering
stress reached prior to fracture. If the behavior is brittle, as for gray cast iron in Fig. 4.8, the highest
stress occurs at the point of fracture. However, in ductile metals, the force, and hence the engineering
stress, reaches a maximum and then decreases prior to fracture, as in Fig. 4.9. In either case, the
highest force reached at any point during the test, P max , is used to obtain the ultimate tensile strength
by dividing by the original cross-sectional area:
P max
σ u = (4.4)
A i
The engineering fracture strength, σ f , is obtained from the force at fracture, P f ,evenifthisis
not the highest force reached:
P f
σ f = (4.5)
A i
Hence, for brittle materials, σ u = σ f , whereas for ductile materials, σ u often exceeds σ f .
The departure from linear-elastic behavior, as in Fig. 4.11, is called yielding and is of
considerable interest. This is simply because stresses that cause yielding result in rapidly increasing
deformation due to the contribution of plastic strain. As discussed in Section 1.2 and illustrated
by Fig. 1.2, any strain in excess of the elastic strain σ/E is plastic strain and is not recovered
on unloading. Hence, plastic strains result in permanent deformation. Such deformation in an