
Page 133 - Mechanical Behavior of Materials
P. 133
134 Chapter 4 Mechanical Testing: Tension Test and Other Basic Tests
Tensile toughness, as just defined, should not be confused with fracture toughness, which is the
resistance to failure in the presence of a crack, as explored in Chapter 8. The tensile toughness is
a useful means of comparing materials, but the fracture toughness should be considered to be the
primary measure of toughness for engineering purposes.
4.3.6 Strain Hardening
The rise in the stress–strain curve following yielding is described by the term strain hardening,as
the material is increasing its resistance with increasing strain. A measure of the degree of strain
hardening is the ratio of the ultimate tensile strength to the yield strength. Hence, we define the
strain hardening ratio = σ u /σ o . Values of this ratio above about 1.4 are considered relatively high
for metals, and those below 1.2 relatively low.
Example 4.1
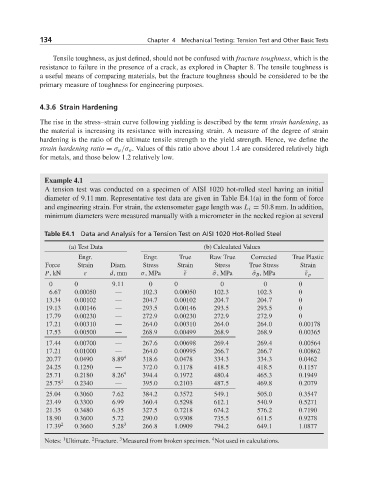
A tension test was conducted on a specimen of AISI 1020 hot-rolled steel having an initial
diameter of 9.11 mm. Representative test data are given in Table E4.1(a) in the form of force
and engineering strain. For strain, the extensometer gage length was L i = 50.8 mm. In addition,
minimum diameters were measured manually with a micrometer in the necked region at several
Table E4.1 Data and Analysis for a Tension Test on AISI 1020 Hot-Rolled Steel
(a) Test Data (b) Calculated Values
Engr. Engr. True Raw True Corrected True Plastic
Force Strain Diam. Stress Strain Stress True Stress Strain
P,kN ε d,mm σ,MPa ˜ ε ˜ σ,MPa ˜ σ B ,MPa ˜ ε p
0 0 9.11 0 0 0 0 0
6.67 0.00050 — 102.3 0.00050 102.3 102.3 0
13.34 0.00102 — 204.7 0.00102 204.7 204.7 0
19.13 0.00146 — 293.5 0.00146 293.5 293.5 0
17.79 0.00230 — 272.9 0.00230 272.9 272.9 0
17.21 0.00310 — 264.0 0.00310 264.0 264.0 0.00178
17.53 0.00500 — 268.9 0.00499 268.9 268.9 0.00365
17.44 0.00700 — 267.6 0.00698 269.4 269.4 0.00564
17.21 0.01000 — 264.0 0.00995 266.7 266.7 0.00862
20.77 0.0490 8.89 4 318.6 0.0478 334.3 334.3 0.0462
24.25 0.1250 — 372.0 0.1178 418.5 418.5 0.1157
25.71 0.2180 8.26 4 394.4 0.1972 480.4 465.3 0.1949
25.75 1 0.2340 — 395.0 0.2103 487.5 469.8 0.2079
25.04 0.3060 7.62 384.2 0.3572 549.1 505.0 0.3547
23.49 0.3300 6.99 360.4 0.5298 612.1 540.9 0.5271
21.35 0.3480 6.35 327.5 0.7218 674.2 576.2 0.7190
18.90 0.3600 5.72 290.0 0.9308 735.5 611.5 0.9278
17.39 2 0.3660 5.28 3 266.8 1.0909 794.2 649.1 1.0877
2
3
1
4
Notes: Ultimate. Fracture. Measured from broken specimen. Not used in calculations.