
Page 138 - Mechanical Behavior of Materials
P. 138
Section 4.4 Trends in Tensile Behavior 139
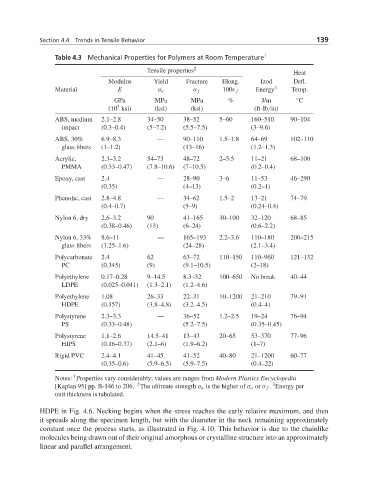
Table 4.3 Mechanical Properties for Polymers at Room Temperature 1
Tensile properties 2 Heat
Modulus Yield Fracture Elong. Izod Defl.
Material E σ o σ f 100ε f Energy 3 Temp.
GPa MPa MPa % J/m ◦ C
3
(10 ksi) (ksi) (ksi) (ft·lb/in)
ABS, medium 2.1–2.8 34–50 38–52 5–60 160–510 90–104
impact (0.3–0.4) (5–7.2) (5.5–7.5) (3–9.6)
ABS, 30% 6.9–8.3 — 90–110 1.5–1.8 64–69 102–110
glass fibers (1–1.2) (13–16) (1.2–1.3)
Acrylic, 2.3–3.2 54–73 48–72 2–5.5 11–21 68–100
PMMA (0.33–0.47) (7.8–10.6) (7–10.5) (0.2–0.4)
Epoxy, cast 2.4 — 28–90 3–6 11–53 46–290
(0.35) (4–13) (0.2–1)
Phenolic, cast 2.8–4.8 — 34–62 1.5–2 13–21 74–79
(0.4–0.7) (5–9) (0.24–0.4)
Nylon 6, dry 2.6–3.2 90 41–165 30–100 32–120 68–85
(0.38–0.46) (13) (6–24) (0.6–2.2)
Nylon 6, 33% 8.6–11 — 165–193 2.2–3.6 110–180 200–215
glass fibers (1.25–1.6) (24–28) (2.1–3.4)
Polycarbonate 2.4 62 63–72 110–150 110–960 121–132
PC (0.345) (9) (9.1–10.5) (2–18)
Polyethylene 0.17–0.28 9–14.5 8.3–32 100–650 No break 40–44
LDPE (0.025–0.041) (1.3–2.1) (1.2–4.6)
Polyethylene 1.08 26–33 22–31 10–1200 21–210 79–91
HDPE (0.157) (3.8–4.8) (3.2–4.5) (0.4–4)
Polystyrene 2.3–3.3 — 36–52 1.2–2.5 19–24 76–94
PS (0.33–0.48) (5.2–7.5) (0.35–0.45)
Polystyrene 1.1–2.6 14.5–41 13–43 20–65 53–370 77–96
HIPS (0.16–0.37) (2.1–6) (1.9–6.2) (1–7)
Rigid PVC 2.4–4.1 41–45 41–52 40–80 21–1200 60–77
(0.35–0.6) (5.9–6.5) (5.9–7.5) (0.4–22)
1
Notes: Properties vary considerably; values are ranges from Modern Plastics Encyclopedia
3
2
[Kaplan 95] pp. B-146 to 206. The ultimate strength σ u is the higher of σ o or σ f . Energy per
unit thickness is tabulated.
HDPE in Fig. 4.6. Necking begins when the stress reaches the early relative maximum, and then
it spreads along the specimen length, but with the diameter in the neck remaining approximately
constant once the process starts, as illustrated in Fig. 4.10. This behavior is due to the chainlike
molecules being drawn out of their original amorphous or crystalline structure into an approximately
linear and parallel arrangement.