
Page 139 - Mechanical Behavior of Materials
P. 139
140 Chapter 4 Mechanical Testing: Tension Test and Other Basic Tests
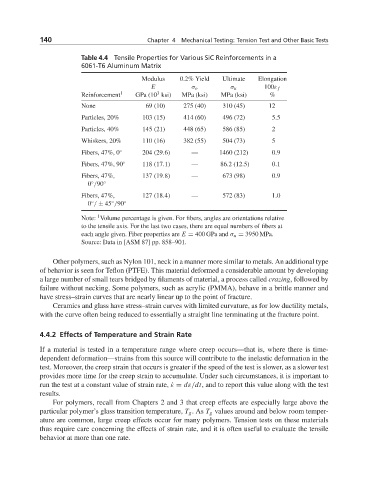
Table 4.4 Tensile Properties for Various SiC Reinforcements in a
6061-T6 Aluminum Matrix
Modulus 0.2% Yield Ultimate Elongation
E σ o σ u 100ε f
3
Reinforcement 1 GPa (10 ksi) MPa (ksi) MPa (ksi) %
None 69 (10) 275 (40) 310 (45) 12
Particles, 20% 103 (15) 414 (60) 496 (72) 5.5
Particles, 40% 145 (21) 448 (65) 586 (85) 2
Whiskers, 20% 110 (16) 382 (55) 504 (73) 5
Fibers, 47%, 0 ◦ 204 (29.6) — 1460 (212) 0.9
Fibers, 47%, 90 ◦ 118 (17.1) — 86.2 (12.5) 0.1
Fibers, 47%, 137 (19.8) — 673 (98) 0.9
0 /90 ◦
◦
Fibers, 47%, 127 (18.4) — 572 (83) 1.0
◦
0 / ± 45 /90 ◦
◦
1
Note: Volume percentage is given. For fibers, angles are orientations relative
to the tensile axis. For the last two cases, there are equal numbers of fibers at
each angle given. Fiber properties are E = 400 GPa and σ u = 3950 MPa.
Source: Data in [ASM 87] pp. 858–901.
Other polymers, such as Nylon 101, neck in a manner more similar to metals. An additional type
of behavior is seen for Teflon (PTFE). This material deformed a considerable amount by developing
a large number of small tears bridged by filaments of material, a process called crazing, followed by
failure without necking. Some polymers, such as acrylic (PMMA), behave in a brittle manner and
have stress–strain curves that are nearly linear up to the point of fracture.
Ceramics and glass have stress–strain curves with limited curvature, as for low ductility metals,
with the curve often being reduced to essentially a straight line terminating at the fracture point.
4.4.2 Effects of Temperature and Strain Rate
If a material is tested in a temperature range where creep occurs—that is, where there is time-
dependent deformation—strains from this source will contribute to the inelastic deformation in the
test. Moreover, the creep strain that occurs is greater if the speed of the test is slower, as a slower test
provides more time for the creep strain to accumulate. Under such circumstances, it is important to
run the test at a constant value of strain rate, ˙ε = dε/dt, and to report this value along with the test
results.
For polymers, recall from Chapters 2 and 3 that creep effects are especially large above the
particular polymer’s glass transition temperature, T g .As T g values around and below room temper-
ature are common, large creep effects occur for many polymers. Tension tests on these materials
thus require care concerning the effects of strain rate, and it is often useful to evaluate the tensile
behavior at more than one rate.