
Page 142 - Mechanical Behavior of Materials
P. 142
Section 4.5 True Stress–Strain Interpretation of Tension Test 143
important. Also, note that the strength is drastically lowered by increased temperature, especially as
◦
T m = 1085 C is approached.
The following generalizations usually apply to the tensile properties of a given material in
a temperature range where creep-related strain-rate effects occur: (1) At a given temperature,
increasing the strain rate increases the strength, but decreases the ductility. (2) For a given strain rate,
decreasing the temperature has the same qualitative effects, specifically, increasing the strength, but
decreasing the ductility.
4.5 TRUE STRESS–STRAIN INTERPRETATION OF TENSION TEST
In analyzing the results of tension tests, and in certain other situations, it is useful to work with true
stresses and strains. Note that engineering stress and strain are most appropriate for small strains
where the changes in specimen dimensions are small. True stresses and strains differ in that finite
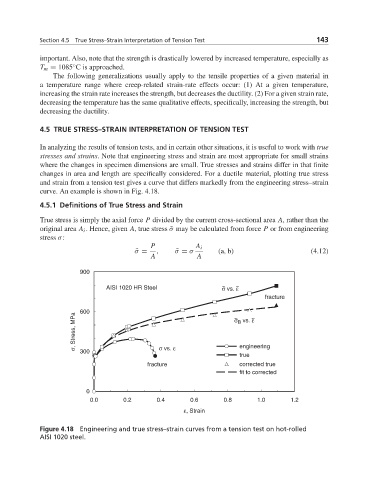
changes in area and length are specifically considered. For a ductile material, plotting true stress
and strain from a tension test gives a curve that differs markedly from the engineering stress–strain
curve. An example is shown in Fig. 4.18.
4.5.1 Definitions of True Stress and Strain
True stress is simply the axial force P divided by the current cross-sectional area A, rather than the
original area A i . Hence, given A,truestress ˜σ may be calculated from force P or from engineering
stress σ:
P A i
˜ σ = , ˜ σ = σ (a, b) (4.12)
A A
900
AISI 1020 HR Steel ~ ~
σ vs. ε
fracture
600 ~ vs. ε
σ, Stress, MPa
~
σ B
engineering
σ vs. ε
300
true
fracture corrected true
fit to corrected
0
0.0 0.2 0.4 0.6 0.8 1.0 1.2
ε, Strain
Figure 4.18 Engineering and true stress–strain curves from a tension test on hot-rolled
AISI 1020 steel.