Page 141 - Mechanical Behavior of Materials
P. 141

142                          Chapter 4  Mechanical Testing: Tension Test and Other Basic Tests

                                                                    12
                                  80


                                          Nylon 101
                                  60
                                                                    8
                                σ, Stress, MPa  40                     σ, ksi


                                                                    4
                                  20      High-density polyethylene (HDPE)

                                        Teflon (PTFE)

                                                                    0
                                  0      0.5  1.0   1.5  2.0   2.5
                                                 ε, Strain
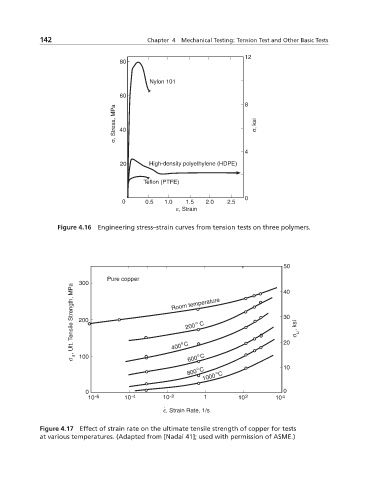
                 Figure 4.16 Engineering stress–strain curves from tension tests on three polymers.


                                                                               50
                              Pure copper
                       300                                                    40
                     σ  , Ult. Tensile Strength, MPa  200  Room temperature   30  σ  , ksi  u


                                                    200   C
                                                       o
                                                                              20
                                                   o
                                                400  C
                                                    600  C
                                                       o
                       100
                     u
                                                    800  C  o                 10
                                                       o
                                                         1000  C
                        0                                                     0
                         10 -6     10 -4      10 -2      1        10 2      10 4
                                              .
                                              ε, Strain Rate, 1/s
            Figure 4.17 Effect of strain rate on the ultimate tensile strength of copper for tests
            at various temperatures. (Adapted from [Nadai 41]; used with permission of ASME.)
   136   137   138   139   140   141   142   143   144   145   146