
Page 137 - Mechanical Behavior of Materials
P. 137
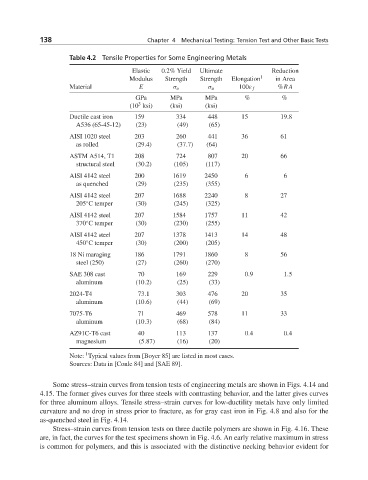
138                          Chapter 4  Mechanical Testing: Tension Test and Other Basic Tests

                    Table 4.2 Tensile Properties for Some Engineering Metals

                                     Elastic  0.2% Yield  Ultimate         Reduction
                                    Modulus   Strength  Strength  Elongation 1  in Area
                    Material           E        σ o       σ u     100ε f     %RA
                                      GPa       MPa      MPa        %         %
                                       3
                                    (10 ksi)    (ksi)    (ksi)
                    Ductile cast iron  159       334      448      15         19.8
                      A536 (65-45-12)  (23)      (49)     (65)
                    AISI 1020 steel   203        260      441      36         61
                      as rolled       (29.4)     (37.7)  (64)
                    ASTM A514, T1     208        724      807      20         66
                      structural steel  (30.2)  (105)    (117)
                    AISI 4142 steel   200       1619     2450       6          6
                      as quenched     (29)      (235)    (355)
                    AISI 4142 steel   207       1688     2240       8         27
                        ◦
                      205 C temper    (30)      (245)    (325)
                    AISI 4142 steel   207       1584     1757      11         42
                      370 C temper    (30)      (230)    (255)
                        ◦
                    AISI 4142 steel   207       1378     1413      14         48
                      450 C temper    (30)      (200)    (205)
                        ◦
                    18 Ni maraging    186       1791     1860       8         56
                      steel (250)     (27)      (260)    (270)
                    SAE 308 cast       70        169      229       0.9        1.5
                      aluminum        (10.2)     (25)     (33)
                    2024-T4            73.1      303      476      20         35
                      aluminum        (10.6)     (44)     (69)
                    7075-T6            71        469      578      11         33
                      aluminum        (10.3)     (68)     (84)
                    AZ91C-T6 cast      40        113      137       0.4        0.4
                      magnesium        (5.87)    (16)     (20)
                        1
                    Note: Typical values from [Boyer 85] are listed in most cases.
                    Sources: Data in [Conle 84] and [SAE 89].

               Some stress–strain curves from tension tests of engineering metals are shown in Figs. 4.14 and
            4.15. The former gives curves for three steels with contrasting behavior, and the latter gives curves
            for three aluminum alloys. Tensile stress–strain curves for low-ductility metals have only limited
            curvature and no drop in stress prior to fracture, as for gray cast iron in Fig. 4.8 and also for the
            as-quenched steel in Fig. 4.14.
               Stress–strain curves from tension tests on three ductile polymers are shown in Fig. 4.16. These
            are, in fact, the curves for the test specimens shown in Fig. 4.6. An early relative maximum in stress
            is common for polymers, and this is associated with the distinctive necking behavior evident for