
Page 171 - Mechanical Behavior of Materials
P. 171
172 Chapter 4 Mechanical Testing: Tension Test and Other Basic Tests
is applied such that the maximum bending stress, calculated by assuming elastic behavior, is
◦
either 0.455 MPa or 1.82 MPa. The temperature is then increased at a rate of 2 C per minute
until the deflection of the beam exceeds 0.25 mm, at which point the temperature is noted. This
heat-deflection temperature is used as an index to compare the resistance of polymers to excessive
softening and deformation as a result of heat. It also gives an indication of the temperature range
where the material loses its usefulness. Some values are given in Table 4.3.
4.9.3 Torsion Test
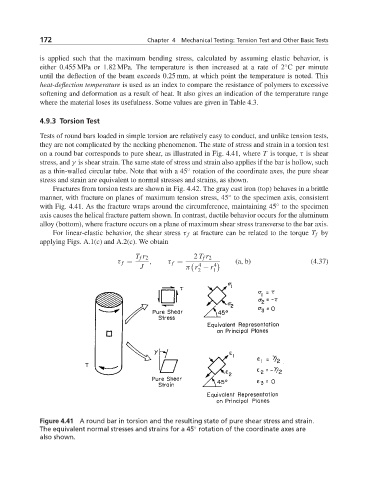
Tests of round bars loaded in simple torsion are relatively easy to conduct, and unlike tension tests,
they are not complicated by the necking phenomenon. The state of stress and strain in a torsion test
on a round bar corresponds to pure shear, as illustrated in Fig. 4.41, where T is torque, τ is shear
stress, and γ is shear strain. The same state of stress and strain also applies if the bar is hollow, such
◦
as a thin-walled circular tube. Note that with a 45 rotation of the coordinate axes, the pure shear
stress and strain are equivalent to normal stresses and strains, as shown.
Fractures from torsion tests are shown in Fig. 4.42. The gray cast iron (top) behaves in a brittle
◦
manner, with fracture on planes of maximum tension stress, 45 to the specimen axis, consistent
with Fig. 4.41. As the fracture wraps around the circumference, maintaining 45 to the specimen
◦
axis causes the helical fracture pattern shown. In contrast, ductile behavior occurs for the aluminum
alloy (bottom), where fracture occurs on a plane of maximum shear stress transverse to the bar axis.
For linear-elastic behavior, the shear stress τ f at fracture can be related to the torque T f by
applying Figs. A.1(c) and A.2(c). We obtain
T f r 2 2 T f r 2
τ f = , τ f = 4 4 (a, b) (4.37)
J π r − r
2 1
Figure 4.41 A round bar in torsion and the resulting state of pure shear stress and strain.
The equivalent normal stresses and strains for a 45 rotation of the coordinate axes are
◦
also shown.