
Page 394 - Mechanical Behavior of Materials
P. 394
Section 8.9 Extensions of Fracture Mechanics Beyond Linear Elasticity 395
√
Here, K = S πa is from LEFM, and ε e and ε p are the elastic and plastic strains corresponding to
the applied stress. The quantity n is the strain-hardening exponent for a stress versus plastic strain
n
relationship of the form σ = Hε , where n ≈ 0.1 to 0.2 is typical for metals. (See Chapter 12 for
p
a detailed discussion of such stress–strain curves.) If the plastic strain ε p is small, the second term
under the radical disappears, and K J = K. However, beyond yielding, ε p increases rapidly, and K J
can become much larger than K. Hence, use of K can be substantially nonconservative.
The use of the J-integral in engineering applications requires that one be able to determine J
for various geometries and crack lengths for the particular material’s nonlinear stress–strain curve.
Handbooks by Kumar (1981) and Zahoor (1989) give extensive tables for calculating J, and the
books by Anderson (2005) and Saxena (1998) also provide useful information.
8.9.3 Fracture Toughness Tests for J Ic
One complexity encountered in J Ic testing is that nonlinearity in the P-v behavior is now due to
a combination of crack growth and plastic deformation. Hence, the beginning of cracking beyond
the initial precrack cannot be determined in a straightforward manner from the P-v curve, and
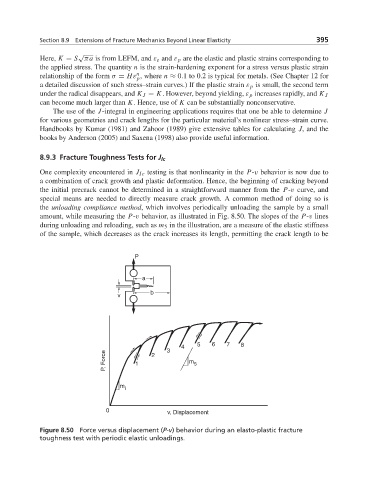
special means are needed to directly measure crack growth. A common method of doing so is
the unloading compliance method, which involves periodically unloading the sample by a small
amount, while measuring the P-v behavior, as illustrated in Fig. 8.50. The slopes of the P-v lines
during unloading and reloading, such as m 5 in the illustration, are a measure of the elastic stiffness
of the sample, which decreases as the crack increases its length, permitting the crack length to be
P
a
b
v
5 6 7 8
4
3
P , Force 1 2 m 5
m
i
0 v, Displacement
Figure 8.50 Force versus displacement (P-v) behavior during an elasto-plastic fracture
toughness test with periodic elastic unloadings.