
Page 396 - Mechanical Behavior of Materials
P. 396
Section 8.9 Extensions of Fracture Mechanics Beyond Linear Elasticity 397
Blunting line
2σ Y
J, J-Integral
J
Q
0.15 mm
0.20 mm 1.50 mm
0
Δa, Crack Extension
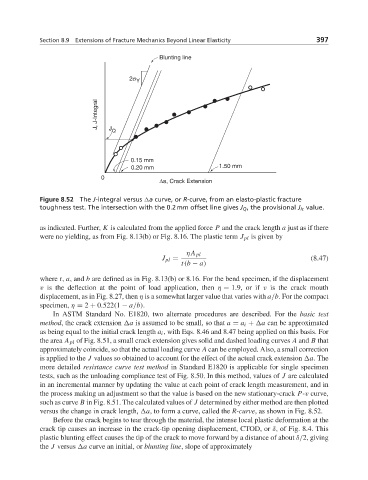
Figure 8.52 The J-integral versus a curve, or R-curve, from an elasto-plastic fracture
toughness test. The intersection with the 0.2 mm offset line gives J Q , the provisional J Ic value.
as indicated. Further, K is calculated from the applied force P and the crack length a just as if there
were no yielding, as from Fig. 8.13(b) or Fig. 8.16. The plastic term J pl is given by
ηA pl
J pl = (8.47)
t(b − a)
where t, a, and b are defined as in Fig. 8.13(b) or 8.16. For the bend specimen, if the displacement
v is the deflection at the point of load application, then η = 1.9, or if v is the crack mouth
displacement, as in Fig. 8.27, then η is a somewhat larger value that varies with a/b. For the compact
specimen, η = 2 + 0.522(1 − a/b).
In ASTM Standard No. E1820, two alternate procedures are described. For the basic test
method, the crack extension a is assumed to be small, so that a = a i + a can be approximated
as being equal to the initial crack length a i , with Eqs. 8.46 and 8.47 being applied on this basis. For
the area A pl of Fig. 8.51, a small crack extension gives solid and dashed loading curves A and B that
approximately coincide, so that the actual loading curve A can be employed. Also, a small correction
is applied to the J values so obtained to account for the effect of the actual crack extension a.The
more detailed resistance curve test method in Standard E1820 is applicable for single specimen
tests, such as the unloading compliance test of Fig. 8.50. In this method, values of J are calculated
in an incremental manner by updating the value at each point of crack length measurement, and in
the process making an adjustment so that the value is based on the new stationary-crack P-v curve,
such as curve B in Fig. 8.51. The calculated values of J determined by either method are then plotted
versus the change in crack length, a, to form a curve, called the R-curve, as shown in Fig. 8.52.
Before the crack begins to tear through the material, the intense local plastic deformation at the
crack tip causes an increase in the crack-tip opening displacement, CTOD, or δ,ofFig.8.4.This
plastic blunting effect causes the tip of the crack to move forward by a distance of about δ/2, giving
the J versus a curve an initial, or blunting line, slope of approximately