
Page 402 - Mechanical Behavior of Materials
P. 402
Problems and Questions 403
8.2 Look at Fig. 8.33, and perform the following tasks:
(a) Obtain approximate values of fracture toughness K Ic and yield strength σ o for A533B
◦
steel at temperatures of −100 C and +0 C.
◦
(b) For each temperature, make a plot of stress versus crack length, showing the yielding
alone line, and the fracture alone curve, as in Fig. 8.6.
(c) Then compare these plots, and comment on the engineering use of this steel at these two
temperatures.
8.3 For each metal in Table 8.1, do the following:
(a) Calculate the transition crack length a t .
(b) Plot these as data points on a logarithmic scale, versus yield strength σ o on a linear scale,
using different symbols for steels, aluminum alloys, and titanium alloys.
(c) Comment on the values obtained and on any trends with yield strength.
8.4 Using Tables 8.1 and 8.2, perform these tasks:
(a) Calculate transition crack lengths at for the following materials: steels AISI 1144,
ASTM A517, and 300-M (both tempers); aluminum alloys 2219-T851 and 7075-T651;
polymers ABS and epoxy; soda-lime glass; and the ceramic SiC. Refer to Table 3.10 or
4.3 for tensile properties for the ceramics and polymers. For brittle materials where the
yield strength σ o is not available, replace it with the ultimate tensile strength σ u .
(b) Comment on the values obtained and any trends observed for the different classes of
material. Which particular materials do you think are likely to be internally flawed?
Sections 8.3 and 8.4
8.5 Define the following concepts in your own words: (a) Modes I, II, and III, (b) crack-tip
singularity, (c) stress intensity factor K, (d) strain energy release rate G, and (e) fracture
toughness K Ic .
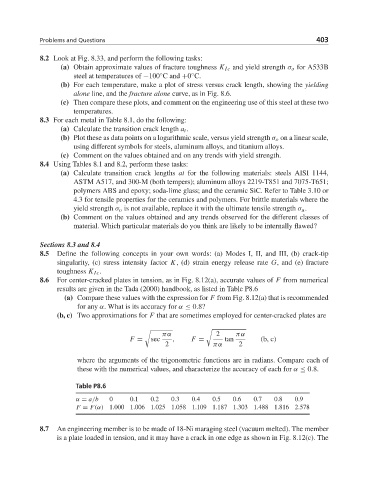
8.6 For center-cracked plates in tension, as in Fig. 8.12(a), accurate values of F from numerical
results are given in the Tada (2000) handbook, as listed in Table P8.6
(a) Compare these values with the expression for F from Fig. 8.12(a) that is recommended
for any α. What is its accuracy for α ≤ 0.8?
(b, c) Two approximations for F that are sometimes employed for center-cracked plates are
!
!
πα 2 πα
F = sec , F = tan (b, c)
2 πα 2
where the arguments of the trigonometric functions are in radians. Compare each of
these with the numerical values, and characterize the accuracy of each for α ≤ 0.8.
Table P8.6
α = a/b 0 0.1 0.2 0.3 0.4 0.5 0.6 0.7 0.8 0.9
F = F(α) 1.000 1.006 1.025 1.058 1.109 1.187 1.303 1.488 1.816 2.578
8.7 An engineering member is to be made of 18-Ni maraging steel (vacuum melted). The member
is a plate loaded in tension, and it may have a crack in one edge as shown in Fig. 8.12(c). The